Omron 2007 Annual Report Download - page 6
Download and view the complete annual report
Please find page 6 of the 2007 Omron annual report below. You can navigate through the pages in the report by either clicking on the pages listed below, or by using the keyword search tool below to find specific information within the annual report.-
 1
1 -
 2
2 -
 3
3 -
 4
4 -
 5
5 -
 6
6 -
 7
7 -
 8
8 -
 9
9 -
 10
10 -
 11
11 -
 12
12 -
 13
13 -
 14
14 -
 15
15 -
 16
16 -
 17
17 -
18
-
19
-
20
-
21
-
22
-
23
-
24
-
25
-
26
-
27
-
28
-
29
-
30
-
31
-
32
-
33
-
34
-
35
-
36
-
37
-
38
-
39
-
40
-
41
-
42
-
43
-
44
-
45
-
46
-
47
-
48
-
49
-
50
-
51
-
52
-
53
-
54
-
55
-
56
-
57
-
58
-
59
-
60
-
61
-
62
-
63
-
64
-
65
-
66
-
67
-
68
-
69
-
70
-
71
-
72
-
73
-
74
-
75
-
76
-
77
-
78
-
79
-
80
-
81
-
82
-
83
-
84
-
85
 |
 |

5
9795 96 009998 02 0301 04 05 06 07
(plan)
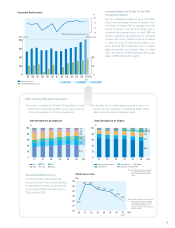
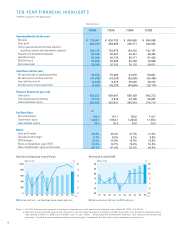
Corporate Performance
(%)
Net sales (left axis)
Operating income (right axis)
0
200
400
600
800
0
40
80
3rd Stage
(FY)
0
4
8
12
Operating income margin (right axis)
(Billions of yen)
(Billions of yen)
1st Stage 2nd Stage
Increased Sales and Profits for the Fifth
Consecutive Period
We have established sales of more than ¥750
billion and operating income of greater than
¥75 billion for fiscal 2007 as management indi-
cators to achieve the last 2nd Stage goal of
doubling total business value. In fiscal 2006 we
actively invested in strengthening our profitabili-
ty base. As a result, despite one-time increases
in costs the fruits of restructuring began to be
seen, and the fifth consecutive term of higher
sales and profits was realized. Also, for fiscal
2007, the effects of M&A activities has brought
sales of ¥800 billion within sight.
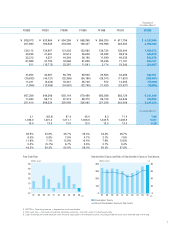
Restructuring of Business Segments
Operational Restructuring
In order to build a robust earnings
structure, we are continuously working
on business efficiency, and are aiming
to achieve an SG&A expense ratio of
22% by fiscal 2007.
Note: Excluding extraordinary factors in the ATM
business and the response to hazardous
chemical substance regulations in FY04.
Also excluding extraordinary factors in
response to hazardous chemical substance
regulations in FY05
(FY)
22.0
22.8
22.8
25.3 25.3
24.3 24.1 23.8
SG&A Expense Ratio
20
21
22
23
24
25
26
02 0300 01 04 05 07
(Target)
06
(%)
0
20
40
60
80
100
02 03
3.8
8.9
18.8
12.6
14.4
41.5
01 04 05 06
Sales Breakdown by Segment
(%)
(FY)
IAB
SSB
ECB
HCB
AEC
Others
(FY)
Sales Breakdown by Region
5.5
15.8
13.3
55.9
0
20
40
60
80
100
02 0301 04 05 06
(%)
Japan (including exports)
Greater China
North America
Southeast Asia and Others
Europe
9.5
Note: Until FY03, Greater China was included
in Southeast Asia and Others. Greater
China includes China, Hong Kong and
Taiwan.
2) In Greater China—which stands out as a major con-
sumer—we are focusing on expanding sales where
major manufacturers are building plants.
1) In order to establish ECB and AEC as pillars of busi-
ness of the same scale as IAB, we are, above all, pro-
moting the expansion of the two segments.