Omron 2007 Annual Report Download - page 7
Download and view the complete annual report
Please find page 7 of the 2007 Omron annual report below. You can navigate through the pages in the report by either clicking on the pages listed below, or by using the keyword search tool below to find specific information within the annual report.-
 1
1 -
 2
2 -
 3
3 -
 4
4 -
 5
5 -
 6
6 -
 7
7 -
 8
8 -
 9
9 -
 10
10 -
 11
11 -
 12
12 -
 13
13 -
 14
14 -
 15
15 -
 16
16 -
 17
17 -
 18
18 -
19
-
20
-
21
-
22
-
23
-
24
-
25
-
26
-
27
-
28
-
29
-
30
-
31
-
32
-
33
-
34
-
35
-
36
-
37
-
38
-
39
-
40
-
41
-
42
-
43
-
44
-
45
-
46
-
47
-
48
-
49
-
50
-
51
-
52
-
53
-
54
-
55
-
56
-
57
-
58
-
59
-
60
-
61
-
62
-
63
-
64
-
65
-
66
-
67
-
68
-
69
-
70
-
71
-
72
-
73
-
74
-
75
-
76
-
77
-
78
-
79
-
80
-
81
-
82
-
83
-
84
-
85
 |
 |

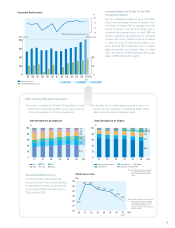
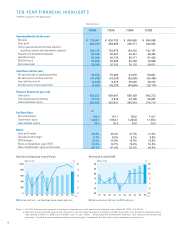
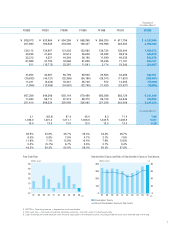
TEN-YEAR FINANCIAL HIGHLIGHTS
OMRON Corporation and Subsidiaries
¥736,651
284,199
168,135
52,028
64,036
97,959
38,280
40,539
(47,075)
(6,536)
(4,697)
630,337
21,813
382,822
165.0
1,660.7
34.0
38.6%
8.7%
13.3%
10.3%
60.7%
¥ 626,782
253,389
152,675
50,501
62,128
92,953
35,763
51,699
(43,020)
8,679
(38,320)
589,061
3,813
362,937
151.1
1,548.1
30.0
40.4%
9.9%
14.8%
10.7%
61.6%
¥ 608,588
249,771
144,219
49,441
56,111
84,753
30,176
61,076
(36,050)
25,026
(40,684)
585,429
24,759
305,810
126.5
1,284.8
24.0
41.0%
9.2%
13.9%
10.4%
52.2%
¥ 584,889
240,054
142,157
46,494
51,403
79,065
26,811
80,687
(34,484)
46,203
(28,119)
592,273
56,687
274,710
110.7
1,148.3
20.0
41.0%
8.8%
13.5%
10.2%
46.4%
Operating Results (for the year):
Net sales
Gross profit
Selling, general and administrative expenses
(excluding research and development expenses)
Research and development expenses
Operating income
EBITDA (note 3)
Net income (loss)
Cash Flows (for the year):
Net cash provided by operating activities
Net cash used in investing activities
Free cash flow (note 4)
Net cash used in financing activities
Financial Position (at year-end):
Total assets
Total interest-bearing liabilities
Total shareholders’ equity
Per Share Data:
Net income (basic)
Shareholders’ equity
Cash dividends (note 5)
Ratios:
Gross profit margin
Operating income margin
EBITDA margin
Return on shareholders’ equity (ROE)
Ratio of shareholders’ equity to total assets
FY2006 FY2005 FY2004 FY2003
Millions of yen
0
200
400
600
800
1,000
97 009998 02 0301 04 05 06 (FY)
Net Sales and Operating Income Margin
Net sales (left axis) Operating income margin (right axis)
(Billions of yen) (%)
0
2
4
6
8
10
-20
-10
0
10
20
30
40
(FY)
97 009998 02 0301 04 05 06
Net Income (Loss) and ROE
(Billions of yen) (%)
Net income (loss) (left axis) ROE (right axis)
-10
-5
0
5
10
15
20
Yen
Notes: 1. The U.S. dollar amounts represent translations of Japanese yen at the approximate exchange rate on March 31, 2007, of ¥118=$1.
2. About the above-mentioned financial data, the profit or loss (excluding the balance of obligation settled) recognized on the transfer of employee pension
fund liabilities in March 31, 2006 is not included in any of “cost of sales”, “selling, general & administrative expenses” and “research and development
expenses”, to enable an easy comparison with previous fiscal years. It is assumed that this profit or loss is allocated in one lump sum.
6