Omron 2004 Annual Report Download - page 3
Download and view the complete annual report
Please find page 3 of the 2004 Omron annual report below. You can navigate through the pages in the report by either clicking on the pages listed below, or by using the keyword search tool below to find specific information within the annual report.-
 1
1 -
 2
2 -
 3
3 -
 4
4 -
 5
5 -
 6
6 -
 7
7 -
 8
8 -
 9
9 -
 10
10 -
 11
11 -
 12
12 -
 13
13 -
 14
14 -
15
-
16
-
17
-
18
-
19
-
20
-
21
-
22
-
23
-
24
-
25
-
26
-
27
-
28
-
29
-
30
-
31
-
32
-
33
-
34
-
35
-
36
-
37
-
38
-
39
-
40
-
41
-
42
-
43
-
44
-
45
-
46
-
47
-
48
-
49
-
50
-
51
-
52
-
53
-
54
-
55
-
56
-
57
-
58
-
59
-
60
-
61
-
62
-
63
-
64
-
65
-
66
-
67
-
68
-
69
-
70
-
71
-
72
 |
 |

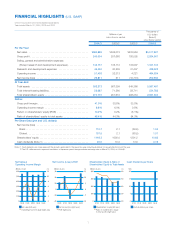
For the Year:
Net sales . . . . . . . . . . . . . . . . . . . . . . . . . . . . . . . . . . . . . . . . . . . . .
Gross profit . . . . . . . . . . . . . . . . . . . . . . . . . . . . . . . . . . . . . . . . . . .
Selling, general and administrative expenses
(Except research and development expenses) . . . . . . . . . . . . . . .
Research and development expenses . . . . . . . . . . . . . . . . . . . . . .
Operating income . . . . . . . . . . . . . . . . . . . . . . . . . . . . . . . . . . . . . .
Net income (loss) . . . . . . . . . . . . . . . . . . . . . . . . . . . . . . . . . . . . . .
At Year-End:
Total assets . . . . . . . . . . . . . . . . . . . . . . . . . . . . . . . . . . . . . . . . . .
Total interest-bearing liabilities . . . . . . . . . . . . . . . . . . . . . . . . . . . . .
Total shareholders’ equity . . . . . . . . . . . . . . . . . . . . . . . . . . . . . . . .
Ratios:
Gross profit margin . . . . . . . . . . . . . . . . . . . . . . . . . . . . . . . . . . . . .
Operating income margin . . . . . . . . . . . . . . . . . . . . . . . . . . . . . . . .
Return on shareholders’ equity (ROE) . . . . . . . . . . . . . . . . . . . . . . .
Ratio of shareholders’ equity to total assets . . . . . . . . . . . . . . . . . .
Per Share Data (yen and U.S. dollars):
Net income (loss) . . . . . . . . . . . . . . . . . . . . . . . . . . . . . . . . . . . . . .
Basic . . . . . . . . . . . . . . . . . . . . . . . . . . . . . . . . . . . . . . . . . . . . . .
Diluted . . . . . . . . . . . . . . . . . . . . . . . . . . . . . . . . . . . . . . . . . . . . .
Shareholders’ equity . . . . . . . . . . . . . . . . . . . . . . . . . . . . . . . . . . . .
Cash dividends (Note 1) . . . . . . . . . . . . . . . . . . . . . . . . . . . . . . . . .
Notes: 1.Cash dividends per share represent the amounts applicable to the respective year, including dividends to be paid after the end of the year.
2.The U.S. dollar amounts represent translations of Japanese yen at the approximate exchange rate on March 31, 2004, of ¥106=$1.
FINANCIAL HIGHLIGHTS (U.S. GAAP)
Omron Corporation and Consolidated Subsidiaries
Years ended March 31, 2004, 2003 and 2002
¥533,964
180,535
134,907
41,407
4,221
(15,773)
549,366
58,711
298,234
33.8%
0.8%
(5.1%)
54.3%
(63.5)
(63.5)
1201.2
13.0
¥584,889
240,054
142,157
46,494
51,403
26,811
592,273
56,687
274,710
41.0%
8.8%
10.2%
46.4%
110.7
107.5
1148.3
20.0
$5,517,821
2,264,661
1,341,104
438,623
484,934
252,934
5,587,481
534,782
2,591,604
1.04
1.01
10.83
0.19
Thousands of
U.S. dollars
(Note 2)
(unless otherwise specified)
Millions of yen
(unless otherwise specified)
2002/3
¥535,073
207,660
135,112
40,235
32,313
511
567,399
71,260
251,610
38.8%
6.0%
0.2%
44.3%
2.1
2.1
1036.0
10.0
2003/3 2004/32004/3
1
200
100
400
300
500
600
0
4
2
8
6
10
12
0
-10
10
0
20
30
-20
-5
5
0
10
15
-10
100
200
300
400
0
40
30
50
60
20
10
5
15
20
0
Net Sales &
Operating Income Margin
Operating income margin [right axis]
Net sales [left axis]
04/303/302/301/300/3 04/303/302/301/300/3 04/303/302/301/301/3 04/303/302/301/301/3
Net Income (Loss) & ROE
ROE [right axis]
Net income (loss) [left axis]
Shareholders’ Equity & Ratio of
Shareholders’ Equity to Total Assets
Ratio of shareholders’ equity
to total assets [right axis]
Shareholders’ equity [left axis]
Cash Dividends per Share
Cash dividends per share
(Billions of yen) (Billions of yen) (Billions of yen) (Yen)(%) (%) (%)