Omron 2004 Annual Report Download - page 12
Download and view the complete annual report
Please find page 12 of the 2004 Omron annual report below. You can navigate through the pages in the report by either clicking on the pages listed below, or by using the keyword search tool below to find specific information within the annual report.-
 1
1 -
 2
2 -
 3
3 -
 4
4 -
 5
5 -
 6
6 -
 7
7 -
 8
8 -
 9
9 -
 10
10 -
 11
11 -
 12
12 -
 13
13 -
 14
14 -
 15
15 -
 16
16 -
 17
17 -
 18
18 -
 19
19 -
 20
20 -
 21
21 -
 22
22 -
23
-
24
-
25
-
26
-
27
-
28
-
29
-
30
-
31
-
32
-
33
-
34
-
35
-
36
-
37
-
38
-
39
-
40
-
41
-
42
-
43
-
44
-
45
-
46
-
47
-
48
-
49
-
50
-
51
-
52
-
53
-
54
-
55
-
56
-
57
-
58
-
59
-
60
-
61
-
62
-
63
-
64
-
65
-
66
-
67
-
68
-
69
-
70
-
71
-
72
 |
 |

Manufacture and sale of
control components for
factory automation, etc.
Manufacture and sale of
electronic components
for consumer electron-
ics, communication
equipment, etc.
Manufacture and sale of
electronic components
for automobiles
Exploration of new busi-
ness, business not
included in above
Manufacture and sale of
medical devices
Provision of equipment,
modules, services, and
solutions in financial, sta-
tion management and
transportation areas
BUSINESS LINEUP
IAB
Other
OTHER
BUSINESSES
HCB
HEALTHCARE
BUSINESS
SSB
SOCIAL
SYSTEMS
BUSINESS
AEC
AUTOMOTIVE
ELECTRONIC
COMPONENTS
BUSINESS
ECB
ELECTRONIC
COMPONENTS
BUSINESS
INDUSTRIAL
AUTOMATION
BUSINESS
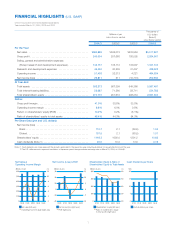
% of Net Sales
(FY2003 Actual)
Net Sales and Operating Income
10
39.3%
FY03
FY02
FY01
229.6
202.5
184.2
34.2
Net Sales Operating Income
24.1
12.1
(Billions of yen)
15.2%
FY03
FY02
FY01
Net Sales Operating Income
*
Operating income for fiscal 2001 includes the figures for
Automotive Electronic Components Business.
(Billions of yen)
89.0
79.4
81.1
14.6
10.3
7.9*
10.1%
FY03
FY02
FY01
Net Sales Operating Income
*
Operating income for fiscal 2001 is included in the figures
for Electronic Components Business.
(Billions of yen)
*
58.8
59.5
50.8
1.0
4.3
23.3%
FY03
FY02
FY01
Net Sales Operating Income
(Billions of yen)
136.0
116.7
128.1
10.4
1.2
-3.0
8.0%
FY03
FY02
FY01
Net Sales Operating Income
(Billions of yen)
47.0
42.3
40.6
7.2
3.8
1.6
4.2%
FY03
FY02
FY01
Net Sales Operating Income
(Billions of yen)
24.5
34.7
49.2
3.8
4.5
2.6
Notes: All the sales described herein are on the basis of segment classification effective in 2003.