O'Reilly Auto Parts 2008 Annual Report Download - page 2
Download and view the complete annual report
Please find page 2 of the 2008 O'Reilly Auto Parts annual report below. You can navigate through the pages in the report by either clicking on the pages listed below, or by using the keyword search tool below to find specific information within the annual report.-
 1
1 -
 2
2 -
 3
3 -
 4
4 -
 5
5 -
 6
6 -
 7
7 -
 8
8 -
 9
9 -
 10
10 -
 11
11 -
 12
12 -
 13
13 -
14
-
15
-
16
-
17
-
18
-
19
-
20
-
21
-
22
-
23
-
24
-
25
-
26
-
27
-
28
-
29
-
30
-
31
-
32
-
33
-
34
-
35
-
36
-
37
-
38
-
39
-
40
-
41
-
42
-
43
-
44
-
45
-
46
-
47
-
48
-
49
-
50
-
51
-
52
-
53
-
54
-
55
-
56
-
57
-
58
-
59
-
60
-
61
-
62
-
63
-
64
-
65
-
66
-
67
-
68
 |
 |

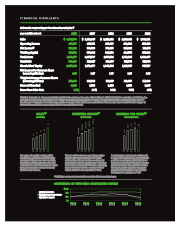
FINANCIAL HIGHLIGHTS
O’Reilly’s dedication to strong and protable growth led to an increase in sales of $1.1 billion in 2008, fueled by the acquisition of CSK Auto, Inc.
CSK added 1,342 stores and allowed us to expand our geographic footprint into 38 states. We generated positive comparable store sales for
the 16th consecutive year since becoming a public company in 1993. Net income and diluted net income per share in 2008 include charges of
$19.2 million and $0.16, respectively, related to the acquisition of CSK.
In thousands, except earnings per share data and operating data (a)
years ended December 31 2008 2007 2006 2005 2004
Sales $ 3,576,553 $ 2,522,319 $ 2,283,222 $ 2,045,318 $ 1,721,241
Operating Income 335,617 305,151 282,315 252,524 190,458
Net Income(a)
186,232 193,988 178,085 164,266 117,674
Working Capital 821,932 573,328 566,892 424,974 479,662
Total Assets 4,193,317 2,279,737 1,977,496 1,718,896 1,432,357
Total Debt 732,695 100,469 110,479 100,774 100,914
Shareholders’ Equity 2,282,218 1,592,477 1,364,096 1,145,769 947,817
Net Income Per Common Share
(assuming dilution) 1.48 1.67 1.55 1.45 1.05
Weighted-Average Common Shares
(assuming dilution) 125,413 116,080 115,119 113,385 111,423
Stores At Year-End 3,285 1,830 1,640 1,470 1,249
Same-Store Sales Gain 1.5% 3.7% 3.3% 7.5% 6.8%
COMPARISON OF FIVE-YEAR CUMULATIVE RETURN
(a) 2004 gures are based on income before cumulative effect of accounting change.
EARNINGS PER SHARE(a)
(Assuming dilution)
A challenging macroeconomic environment
as well as the acquisition of CSK resulted in
a dilution to earnings in 2008. Diluted net
income per share in 2008 includes charges
of $0.16 related to the acquisition of CSK.
We remain positive about the Company’s
prospects for EPS growth as we continue
to integrate the operations of CSK.
04 05 06 07 08
1.05
1.45
1.55
1.67
1.48
OPERATING INCOME(a)
(In thousands)
We were able to increase operating margins
10% by continuing to build on our strong
relationships with our vendors as well as by
ensuring we carry the products our customers
desire at each of our 3,285 locations. Operating
income for 2008 includes a charge of $9.6
million related to the acquisition of CSK.
04 05 06 07 08
190,458
252,524
282,315
305,151
335,617
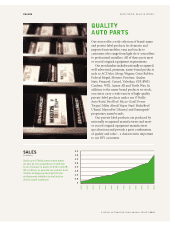
SALES(a)
(In millions)
Our aggressive growth strategy, which
included the acquisition of CSK and the
opening of 150 net new stores in 2008,
resulted in a 42% increase in sales. Our
commitment to excellent customer service
and professionalism continue to be key
factors in our success.
04 05 06 07 08
1.7
2.0
2.3
2.5
3.5
DEC. 31
2003
DEC. 31
2004
DEC. 30
2005
DEC. 29
2006
DEC. 31
2007
DEC. 31
2008
100
50
150
$ 200
O’Reilly Auto Parts
NASDAQ Retail Trade Stocks
NASDAQ US Market