North Face 2000 Annual Report Download - page 36
Download and view the complete annual report
Please find page 36 of the 2000 North Face annual report below. You can navigate through the pages in the report by either clicking on the pages listed below, or by using the keyword search tool below to find specific information within the annual report.-
 1
1 -
2
-
3
-
4
-
5
-
6
-
7
-
8
-
9
-
10
-
11
-
12
-
13
-
14
-
15
-
16
-
17
-
18
-
19
-
20
-
21
-
22
-
23
-
24
-
25
-
 26
26 -
 27
27 -
 28
28 -
 29
29 -
 30
30 -
 31
31 -
 32
32 -
 33
33 -
 34
34 -
 35
35 -
 36
36 -
 37
37 -
 38
38 -
 39
39 -
 40
40
 |
 |

34
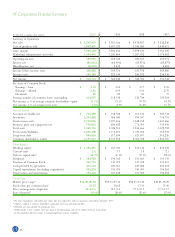
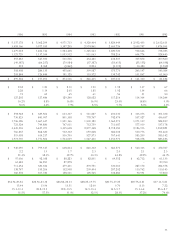
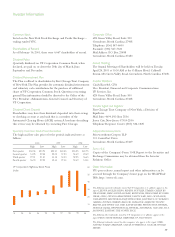
VF Corporation Financial Summary
In thousands, except per share amounts 200041999 1998 1997
Summary of Operations
Net sales $ 5,747,879 $ 5,551,616 $ 5,478,807 $ 5,222,246
Cost of products sold 3,842,451 3,657,120 3,586,686 3,440,611
Gross margin 1,905,428 1,894,496 1,892,121 1,781,635
Marketing, administrative and other 1,395,435 1,241,864 1,207,952 1,176,562
Operating income 509,993 652,632 684,169 605,073
Interest, net (81,032) (62,490) (55,871) (25,877)
Miscellaneous, net (8,279) 5,434 3,300 6,684
Income before income taxes 420,682 595,576 631,598 585,880
Income taxes 160,348 229,334 243,292 234,938
Net income $ 260,334 $ 366,242 $ 388,306 $ 350,942
Per share of Common Stock1
Earnings – basic $ 2.25 $ 3.04 $ 3.17 $ 2.76
Earnings – diluted 2.21 2.99 3.10 2.70
Dividends .89 .85 .81 .77
Average number of common shares outstanding 114,075 118,538 120,744 125,504
Net income as % of average common shareholders’ equity 11.7% 17.3% 19.7% 18.2%
Net income as % of average total assets 6.0% 8.9% 10.2% 10.1%
Financial Position
Accounts receivable, net $ 716,299 $ 732,502 $ 705,734 $ 587,934
Inventories 1,124,438 964,040 954,007 774,755
Total current assets 2,110,096 1,877,416 1,848,152 1,601,466
Property, plant and equipment, net 776,015 804,422 776,091 705,990
Total assets 4,358,156 4,026,514 3,836,666 3,322,782
Total current liabilities 1,006,200 1,113,473 1,033,006 765,908
Long-term debt 905,036 517,834 521,657 516,226
Common shareholders’ equity 2,191,813 2,163,818 2,066,308 1,866,769
Other Statistics
Working capital $ 1,103,896 $ 763,943 $ 815,146 $ 835,558
Current ratio 2.1 1.7 1.8 2.1
Debt to capital ratio234.7% 30.1% 27.1% 22.5%
Dividends $ 104,920 $ 104,302 $ 101,660 $ 100,141
Purchase of Common Stock 105,723 149,075 147,398 391,651
Cash provided by operations 443,314 423,361 429,282 460,652
Capital expenditures (excluding acquisitions) 125,224 150,076 189,059 154,262
Depreciation and amortization 173,422 167,432 161,385 156,252
Market Data
Market price range1$36.90-20.94 $55.00-27.44 $54.69-33.44 $48.25-32.25
Book value per common share119.52 18.62 17.30 15.40
Price earnings ratio – high-low 16.4-9.3 18.1-9.0 17.3-10.5 17.5-11.7
Rate of payout339.6% 28.0% 25.6% 27.9%
1Per share computations and market price ranges have been adjusted to reflect a two-for-one stock split in November 1997.
2Capital is defined as common shareholders’equity plus short-term and long-term debt.
3Dividends per share divided by earnings per share.
42000 includes a $76.7 million ($.67 per share) restructuring charge and a $6.8 million ($.06 per share) charge
for the cumulative effect of a change in accounting policy for revenue recognition.