North Face 2000 Annual Report Download - page 35
Download and view the complete annual report
Please find page 35 of the 2000 North Face annual report below. You can navigate through the pages in the report by either clicking on the pages listed below, or by using the keyword search tool below to find specific information within the annual report.-
 1
1 -
2
-
3
-
4
-
5
-
6
-
7
-
8
-
9
-
10
-
11
-
12
-
13
-
14
-
15
-
16
-
17
-
18
-
19
-
20
-
21
-
22
-
23
-
24
-
 25
25 -
 26
26 -
 27
27 -
 28
28 -
 29
29 -
 30
30 -
 31
31 -
 32
32 -
 33
33 -
 34
34 -
 35
35 -
 36
36 -
 37
37 -
 38
38 -
 39
39 -
 40
40
 |
 |

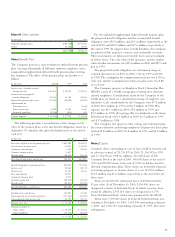
Note Q Earnings Per Share
In thousands, except per share amounts 2000 1999 1998
Basic earnings per share:
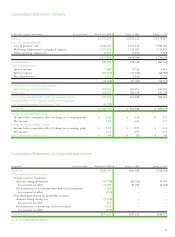
Net income $260,334 $366,242 $388,306
Less Preferred Stock dividends
and redemption premium 4,158 6,394 5,912
Net income available for
Common Stock $256,176 $359,848 $382,394
Weighted average Common
Stock outstanding 114,075 118,538 120,744
Basic earnings per share $ 2.25 $ 3.04 $ 3.17
Diluted earnings per share:
Net income $260,334 $366,242 $388,306
Increased ESOP expense if
Preferred Stock were converted
to Common Stock 925 1,036 1,136
Net income available for
Common Stock and dilutive
securities $259,409 $365,206 $387,170
Weighted average Common
Stock outstanding 114,075 118,538 120,744
Additional Common Stock
resulting from dilutive securities:
Preferred Stock 2,561 2,724 2,854
Stock options and other 582 996 1,397
Weighted average Common
Stock and dilutive securities
outstanding 117,218 122,258 124,995
Diluted earnings per share $ 2.21 $ 2.99 $ 3.10
Outstanding options to purchase 6.5 million shares of Common
Stock have been excluded from the computation of diluted earn-
ings per share in 2000 and 2.1 million shares in 1999 because the
option exercise prices were greater than the average market price
of the Common Stock.
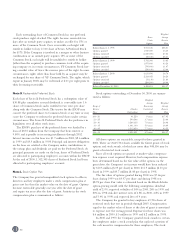
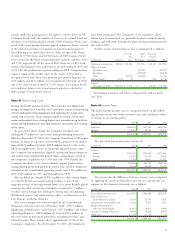
Note R Financial Instruments
The carrying amount and fair value of financial instruments
included in the balance sheets are as follows:
In thousands 2000 1999
Carrying Fair Carrying Fair
Amount Value Amount Value
Financial liabilities:
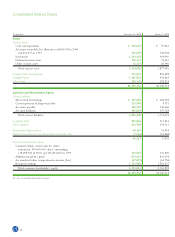
Short-term borrowings $ 147,005 $ 147,005 $408,932 $408,932
Long-term debt 1,019,035 1,028,460 522,585 507,297
Series B Preferred Stock 48,483 91,052 51,544 80,133
The fair value of the Company’s short-term and long-term debt
is estimated based on quoted market prices or values of comparable
borrowings. The fair value of the Series B Preferred Stock is based
on a valuation by an independent financial consulting firm.
The Company enters into short-term foreign currency forward
exchange contracts to manage exposures related to specific foreign
currency transactions or anticipated cash flows. The amounts of
the contracts, and related gains and losses, are not material. The fair
value of foreign currency financial instruments is not significant.
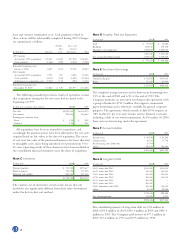
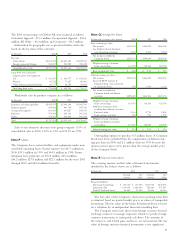
The 2000 restructuring costs (Note M) were incurred as follows:
Consumer Apparel – $71.0 million; Occupational Apparel – $34.6
million; All Other – $6.0 million; and Corporate – $8.3 million.
Information by geographic area is presented below, with sales
based on the location of the customer:
In thousands 2000 1999 1998
Net sales:
United States $4,803,872 $4,605,624 $4,552,785
Foreign, primarily Europe 944,007 945,992 926,022
Consolidated net sales $5,747,879 $5,551,616 $5,478,807
Long-lived assets, primarily
property, plant and equipment:
U.S. $ 610,287 $ 650,577 $ 634,231
Mexico 85,762 71,627 60,400
Other foreign, primarily Europe 80,777 83,029 83,842
Total long-lived assets $ 776,826 $ 805,233 $ 778,473
Worldwide sales by product category are as follows:
In thousands 2000 1999 1998
Jeanswear and related products $2,985,975 $2,936,196 $2,962,790
Intimate apparel 894,580 981,798 965,782
Occupational apparel 661,635 640,227 482,931
Knitwear 472,298 453,103 506,365
Other 733,391 540,292 560,939
Total $5,747,879 $5,551,616 $5,478,807
Sales to one domestic discount store group comprise 13.9% of
consolidated sales in 2000, 13.0% in 1999 and 12.3% in 1998.
Note P Leases
The Company leases certain facilities and equipment under non-
cancelable operating leases. Rental expense was $67.1 million in
2000, $59.3 million in 1999 and $64.3 million in 1998. Future
minimum lease payments are $55.8 million, $45.4 million,
$36.2 million, $27.8 million and $22.1 million for the years 2001
through 2005 and $62.4 million thereafter.
33