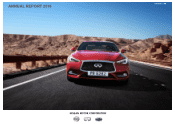
Nissan 2016 Annual Report Download - page 5
Download and view the complete annual report
Please find page 5 of the 2016 Nissan annual report below. You can navigate through the pages in the report by either clicking on the pages listed below, or by using the keyword search tool below to find specific information within the annual report.-
 1
1 -
 2
2 -
 3
3 -
 4
4 -
 5
5 -
 6
6 -
 7
7 -
 8
8 -
 9
9 -
 10
10 -
 11
11 -
 12
12 -
 13
13 -
 14
14 -
 15
15 -
 16
16 -
17
-
18
-
19
-
20
 |
 |
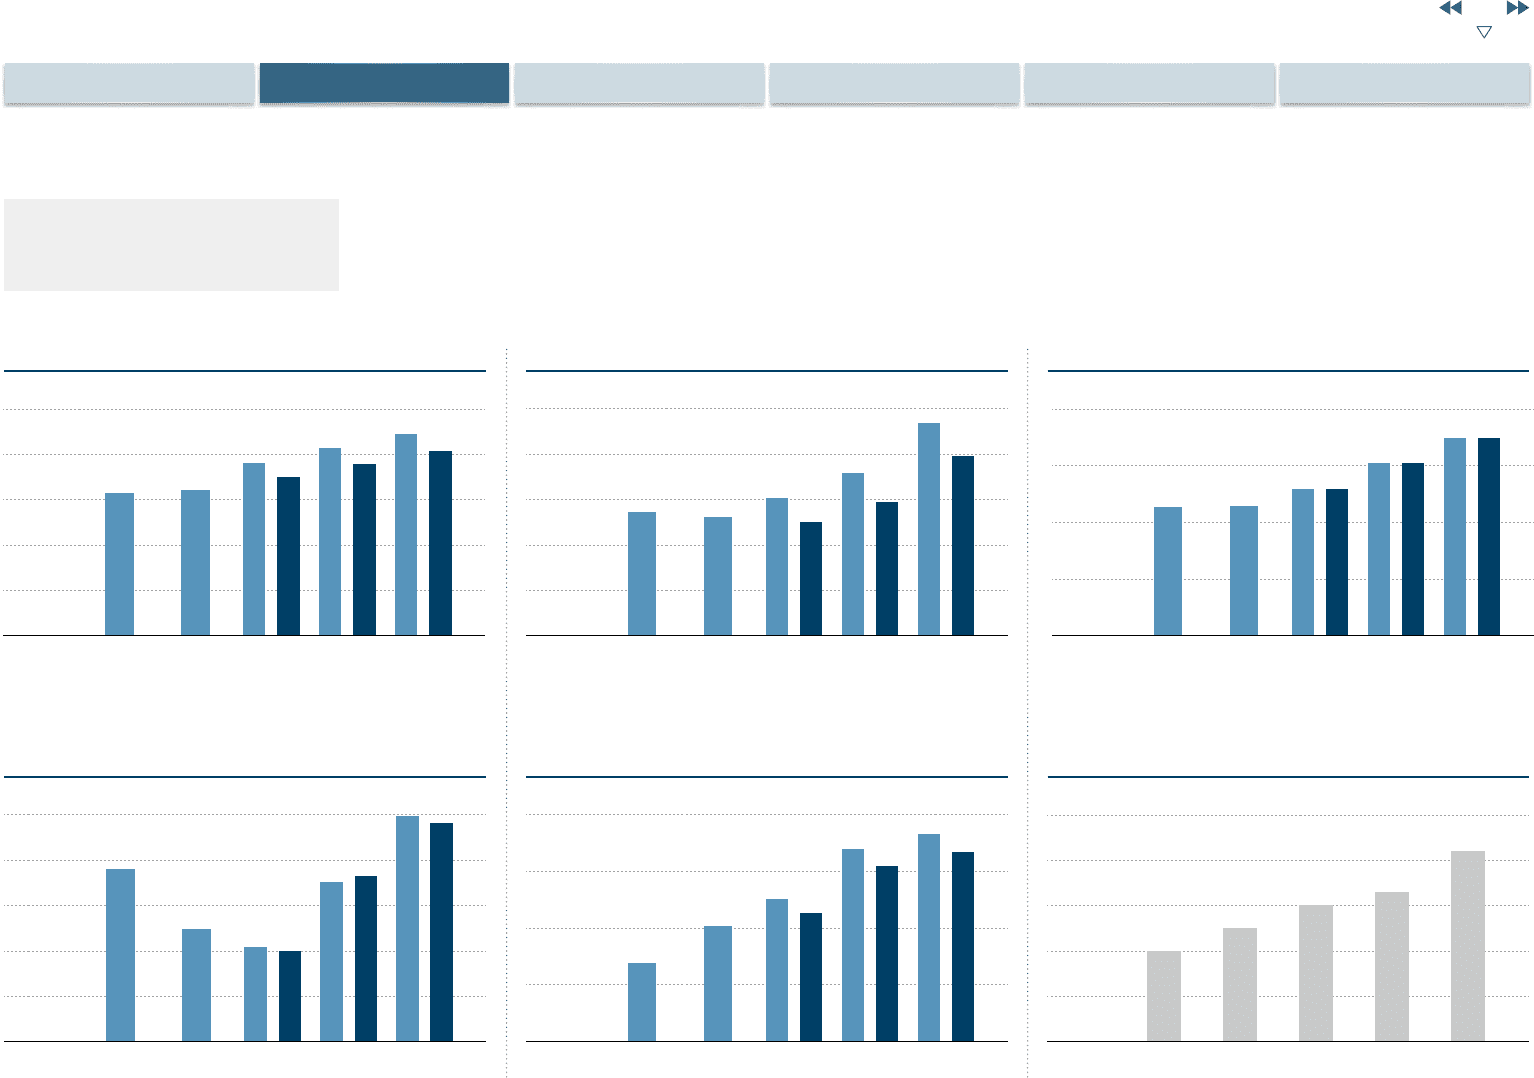
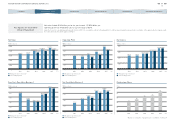
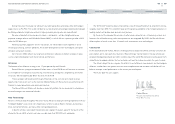
(Billions of yen) (Billions of yen)
Net IncomeNet Sales
Free Cash Flow (Auto Business)
Operating Profit
Net Cash (Auto Business)
(Billions of yen)
(Billions of yen) (Billions of yen)
(FY) (FY) (FY)
(FY) (FY)
■ Management pro forma basis*
■ China JV Equity basis
■ Management pro forma basis*
■ China JV Equity basis
■ Management pro forma basis*
■ China JV Equity basis
■ Management pro forma basis*
■ China JV Equity basis
■ Management pro forma basis*
■ China JV Equity basis
Dividend per Share
(Yen)
(FY)
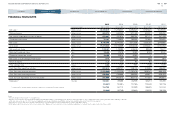
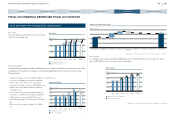
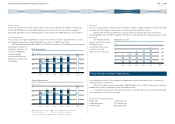
Net sales climbed 814.3 billion yen for the year to reach 12,189.5 billion yen.
Operating profit was 793.3 billion yen, for a profit margin of 6.5%.
Under the forecast of consolidated operating results after fiscal 2013, the consolidation method for Dongfeng Motor Co., Ltd. has been changed from proportionate consolidation to the equity method in comparison with
the results until fiscal 2012 by the adoption of IFRS11.
Key figures for fiscal 2015
(China JV Equity Basis)
* Based on continuation of proportionate consolidation of China JV
0
30
20
50
40
10
2011 2012 2013 2014 2015
20
25
33
30
42
0
100
200
300
400
500
2011 2012 2013 2014 2015
379.5
208.1
352.3 365.8
199.7
248.6
497.6 481.2
0
1,350
900
1,800
450
20132011 2012 2014 2015
619.8
915.9
1,133.7
1,524.5
1,390.1
1,015.9
1,645.8
1,502.9
3,000
6,000
9,000
12,000
15,000
0
2011 2012 2013 2014
9,409.0 9,629.6
11,434.8
12,406.3
11,375.2
10,482.5
13,365.6
12,189.5
2015
0
1,000
800
200
400
600
2011 2012 2013 2014 2015
545.8 523.5
605.7
718.6
498.4
589.6
935.5
793.3
300
150
450
600
0
2011 2012 2013 2014 2015
341.4 342.4
389.0 389.0
457.6 457.6
523.8 523.8
04
NISSAN MOTOR CORPORATION ANNUAL REPORT 2016
CONTENTS
CORPORATE FACE TIME
TOP MESSAGE
NISSAN POWER 88
PERFORMANCE
CORPORATE GOVERNANCE