Nissan 2016 Annual Report Download - page 4
Download and view the complete annual report
Please find page 4 of the 2016 Nissan annual report below. You can navigate through the pages in the report by either clicking on the pages listed below, or by using the keyword search tool below to find specific information within the annual report.-
 1
1 -
 2
2 -
 3
3 -
 4
4 -
 5
5 -
 6
6 -
 7
7 -
 8
8 -
 9
9 -
 10
10 -
 11
11 -
 12
12 -
 13
13 -
 14
14 -
 15
15 -
16
-
17
-
18
-
19
-
20
 |
 |

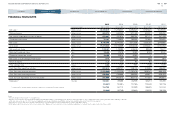
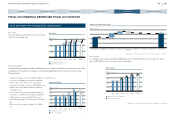
2015 2014 2013 2012*2 2011
For the years ended Mar. 31, 2016 Mar. 31, 2015 Mar. 31, 2014 Mar. 31, 2013 Mar. 31, 2012
Net sales*1 Millions of yen 12,189,519 11,375,207 10,482,520 8,737,320 9,409,026
Ordinary income Millions of yen 862,272 694,232 527,189 504,421 535,090
Net income attributable to owners of parent Millions of yen 523,841 457,574 389,034 341,117 341,433
Comprehensive income Millions of yen 75,107 719,903 796,533 721,860 290,600
Net assets Millions of yen 5,140,745 5,247,262 4,671,528 4,036,030 3,449,997
Total assets Millions of yen 17,373,643 17,045,659 14,703,403 12,442,337 11,072,053
Net assets per share Yen 1,132.61 1,152.83 1,035.06 890.38 750.77
Basic net income per share Yen 125.00 109.15 92.82 81.39 81.67
Diluted net income per share*3 Yen 124.99 109.14 92.82
- -
Net assets as a percentage of total assets %27.2 28.4 29.5 30.0 28.4
Return on equity %11.0 10.0 9.6 9.9 11.2
Price earnings ratio Times 8.33 11.21 9.91 11.08 10.79
Cash flows from operating activities Millions of yen 927,013 692,747 728,123 412,257 696,297
Cash flows from investing activities Millions of yen (1,229,280) (1,022,025) (1,080,416) (838,047) (685,053)
Cash flows from financing activities Millions of yen 530,606 245,896 396,925 433,817 (308,457)
Cash and cash equivalents at end of fiscal year Millions of yen 992,095 802,612 832,716 711,901 840,871
Employees*4 Number 152,421 149,388 142,925 130,274 157,365
(19,007) (20,381) (21,750) (22,442) (34,775)
( ) represents the average number of part-time employees not included in the above numbers 154,700 151,710 147,939 136,625 161,513
(19,343) (20,748) (22,642) (23,307) (35,099)
Notes:
*1 Net sales are presented exclusive of consumption tax.
*2 Effective from fiscal 2013, International Financial Reporting Standards (IFRS) 11 Joint Arrangements, which was released on May 12, 2011, and International Accounting Standards (IAS) 19 Employee Benefits,
which was released on June 16, 2011, have been applied in some foreign subsidiaries and affiliates, and key financial data and trends for fiscal 2012 are adjusted.
*3 Diluted net income per share for fiscal 2011 and fiscal 2012 is not presented because the Company had no securities with dilutive effects.
*4 Staff numbers, which are presented as the lower numbers in the “Employees” line, include those of unconsolidated subsidiaries accounted for by the equity method as reference data.
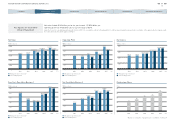
FINANCIAL HIGHLIGHTS
03
NISSAN MOTOR CORPORATION ANNUAL REPORT 2016
CONTENTS
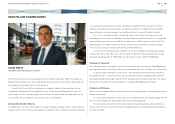
CORPORATE FACE TIME
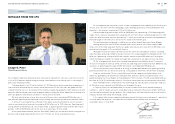
TOP MESSAGE
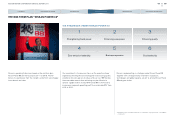
NISSAN POWER 88
PERFORMANCE
CORPORATE GOVERNANCE