Nissan 2016 Annual Report Download - page 18
Download and view the complete annual report
Please find page 18 of the 2016 Nissan annual report below. You can navigate through the pages in the report by either clicking on the pages listed below, or by using the keyword search tool below to find specific information within the annual report.-
 1
1 -
2
-
3
-
4
-
5
-
6
-
7
-
 8
8 -
 9
9 -
 10
10 -
 11
11 -
 12
12 -
 13
13 -
 14
14 -
 15
15 -
 16
16 -
 17
17 -
 18
18 -
 19
19 -
 20
20
 |
 |
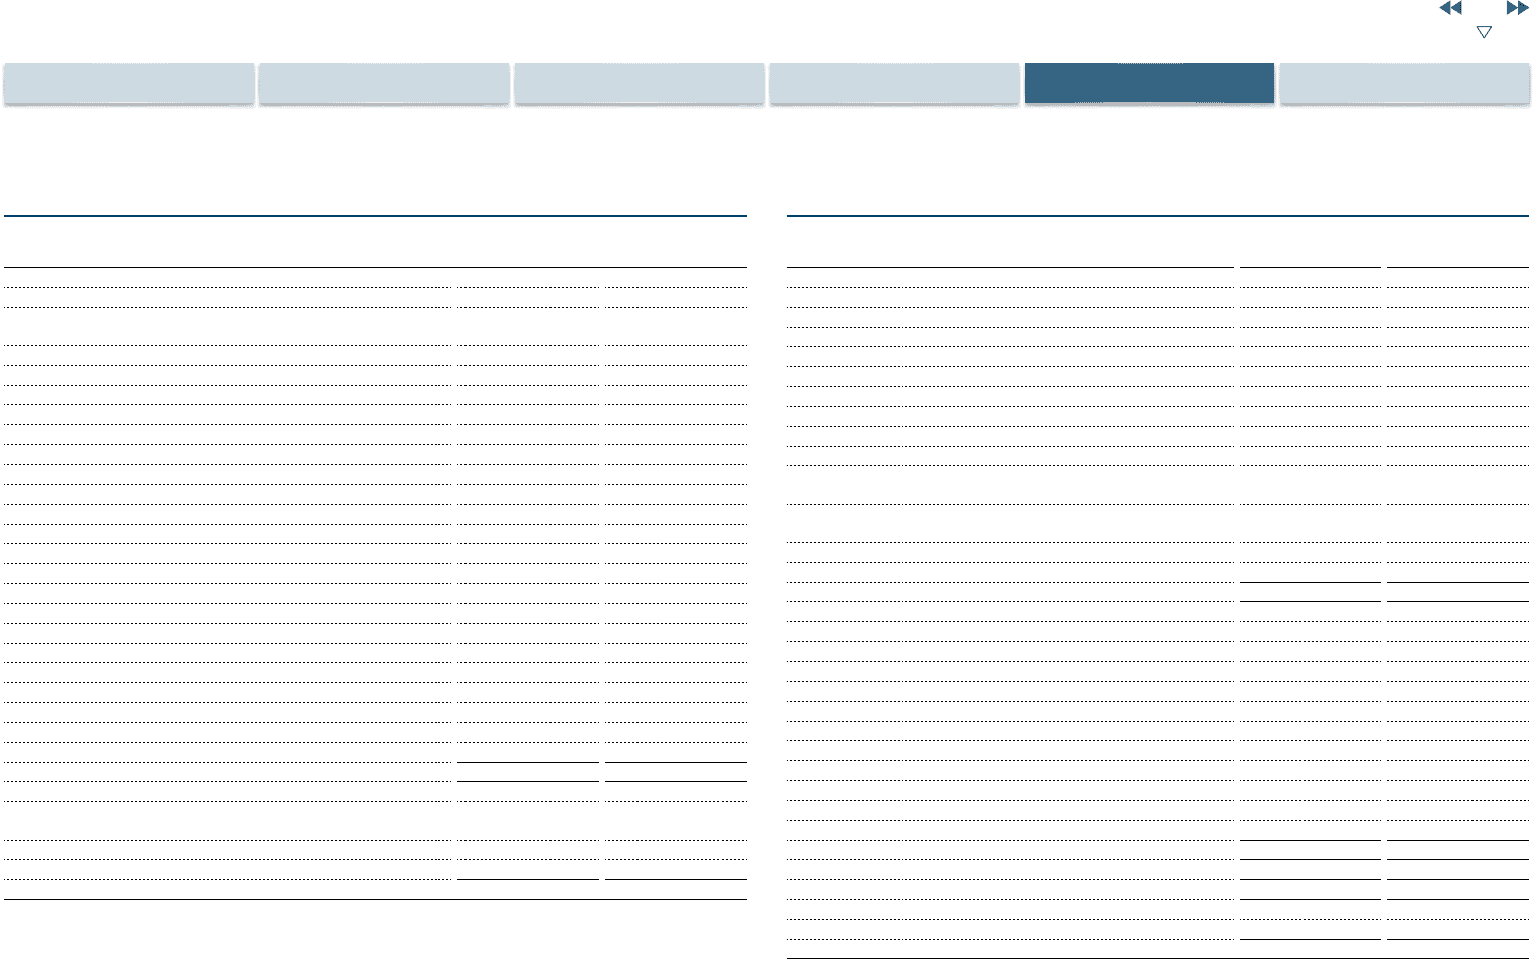
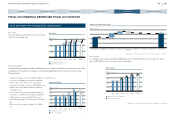
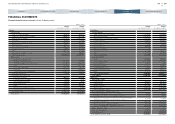
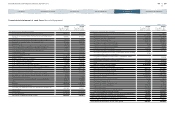
Consolidated statement of cash flows (China JV Equity basis)
(Millions of yen)
FY2014
(From April 1, 2014
to March 31, 2015)
FY2015
(From April 1, 2015
to March 31, 2016)
Cash flows from operating activities
Income before income taxes and minority interests 687,421 732,934
Depreciation and amortization (for fixed assets excluding leased
vehicles) 398,982 424,881
Depreciation and amortization (for long term prepaid expenses) 28,003 18,666
Depreciation and amortization (for leased vehicles) 355,292 389,339
Impairment loss 16,103 42,087
Gain on contribution of securities to retirement benefit trust (17,725) ―
Increase (decrease) in allowance for doubtful receivables 13,471 16,669
Loss (gain) for residual value risk of leased vehicles 41,911 53,737
Quality-related costs ―90,700
Interest and dividend income (31,748) (32,433)
Interest expense 112,823 111,906
Equity in losses (earnings) of affiliates (106,513) (122,524)
Loss (gain) on sales of fixed assets (16,709) (4,074)
Loss on disposal of fixed assets 17,069 13,274
Loss (gain) on sales of investment securities (2,022) (23,338)
Decrease (increase) in trade notes and accounts receivable (64,118) 15,171
Decrease (increase) in sales finance receivables (707,321) (830,209)
Decrease (increase) in inventories (82,435) (17,244)
Increase (decrease) in trade notes and accounts payable 125,840 217,587
Amortization of net retirement benefit obligation at transition 9,098 ―
Retirement benefit expenses 26,789 13,581
Payments related to net defined benefit assets and liabilities (25,815) (29,854)
Other 55,372 55,978
Subtotal 833,768 1,136,834
Interest and dividends received 25,793 33,222
Proceeds from dividends income from affiliates accounted for by
equity method 145,780 144,961
Interest paid (114,659) (110,439)
Income taxes paid (197,899) (277,565)
Net cash provided by operating activities 692,747 927,013
(Millions of yen)
FY2014
(From April 1, 2014
to March 31, 2015)
FY2015
(From April 1, 2015
to March 31, 2016)
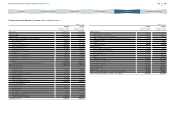
Cash flows from investing activities
Net decrease (increase) in short-term investments 3,405 4,855
Purchase of fixed assets (513,268) (531,251)
Proceeds from sales of fixed assets 88,318 80,320
Purchase of leased vehicles (1,070,654) (1,385,990)
Proceeds from sales of leased vehicles 537,721 560,861
Payments of long-term loans receivable (534) (3,018)
Collection of long-term loans receivable 310 8,285
Purchase of investment securities (25,591) (24,869)
Proceeds from sales of investment securities 6,104 25,192
Proceeds from (payments for) sales of subsidiaries' shares resulting
in changes in the scope of consolidation (156) ―
Proceeds from (payments for) purchase of subsidiaries' shares
resulting in changes in the scope of consolidation ―(6,354)
Net decrease (increase) in restricted cash (36,258) 44,839
Other (11,422) (2,150)
Net cash used in investing activities (1,022,025) (1,229,280)
Cash flows from financing activities
Net increase (decrease) in short-term borrowings 445,170 420,085
Proceeds from long-term borrowings 981,970 1,824,367
Proceeds from issuance of bonds 325,513 270,592
Repayments of long-term borrowings (1,094,942) (1,545,177)
Redemption of bonds (238,124) (212,033)
Proceeds from non-controlling interests 6,242 4,914
Purchase of treasury stock (61) (28,325)
Proceeds from sales of treasury stock 618 303
Repayments of lease obligations (34,047) (23,093)
Cash dividends paid (132,054) (157,239)
Cash dividends paid to non-controlling interests (14,389) (23,788)
Net cash provided by financing activities 245,896 530,606
Effects of exchange rate changes on cash and cash equivalents 50,660 (45,107)
Increase (decrease) in cash and cash equivalents (32,722) 183,232
Cash and cash equivalents at beginning of the period 832,716 802,612
Increase due to inclusion in consolidation 2,618 6,251
Cash and cash equivalents at end of the period 802,612 992,095
17
NISSAN MOTOR CORPORATION ANNUAL REPORT 2016
PERFORMANCE
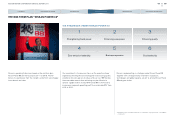
CONTENTS
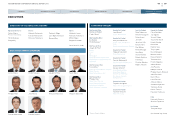
CORPORATE FACE TIME
TOP MESSAGE
NISSAN POWER 88
CORPORATE GOVERNANCE