Nissan 2016 Annual Report Download - page 14
Download and view the complete annual report
Please find page 14 of the 2016 Nissan annual report below. You can navigate through the pages in the report by either clicking on the pages listed below, or by using the keyword search tool below to find specific information within the annual report.-
 1
1 -
2
-
3
-
 4
4 -
 5
5 -
 6
6 -
 7
7 -
 8
8 -
 9
9 -
 10
10 -
 11
11 -
 12
12 -
 13
13 -
 14
14 -
 15
15 -
 16
16 -
 17
17 -
 18
18 -
 19
19 -
 20
20
 |
 |
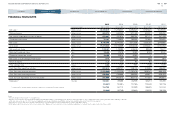
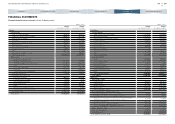
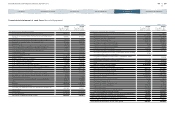
Balance sheet
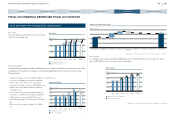
Total assets increased by 1.9% to 17,373.6 billion yen compared to March 31, 2015.
Current assets increased by 4.2% to 10,747.6 billion yen compared to March 31, 2015. This
was mainly attributable to increases in sales finance receivables by 340.4 billion yen and cash on
hand and in banks by 157.7 billion yen. Fixed assets decreased by 1.5% to 6,626.1 billion yen
compared to March 31, 2015.
Current liabilities increased by 5.4% to 6,764.2 billion yen compared to March 31, 2015. This
was mainly due to increases in commercial paper by 299.2 billion yen and current portion of bonds
by 141.1 billion yen. Long-term liabilities increased by 1.6% to 5,468.7 billion yen compared to
March 31, 2015. This was mainly due to increases in net defined benefit liability by 87.9 billion yen,
long-term borrowings by 38.4 billion yen and deferred tax liabilities by 18.3 billion yen despite a
decrease in bonds by 125.5 billion yen.
Net assets decreased by 2.0% to 5,140.7 billion yen compared to 5,247.3 billion yen as of
March 31, 2015. This was mainly due to increases in translation adjustments (loss) by 335.6 billion
yen and remeasurements of defined benefit plans (loss) by 73.8 billion yen and a decrease in
unrealized holding gain and loss on securities by 31.6 billion yen despite an increase in retained
earnings by 338.9 billion yen.
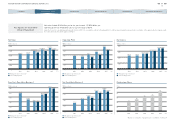
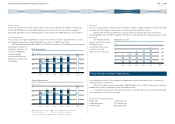
Free cash flow and net cash (auto business)
For fiscal 2015, Nissan achieved a positive free cash flow of 481.2 billion yen. At the end of fiscal
2015, our net automotive cash improved from the previous fiscal year to 1,502.9 billion yen.
The Company continues to maintain a close focus on its inventory of new vehicles. Inventory stood
at 790,000 units at the end of fiscal 2015. Nissan continues to manage inventory carefully in order to
limit its impact on free cash flow.
Aa3 AA–
A1 A+
A2 A
A3 A–
Baa1 BBB+
Baa2 BBB
Baa3 BBB–
Ba1 BB+
Financial Position (China JV Equity Basis)
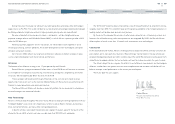
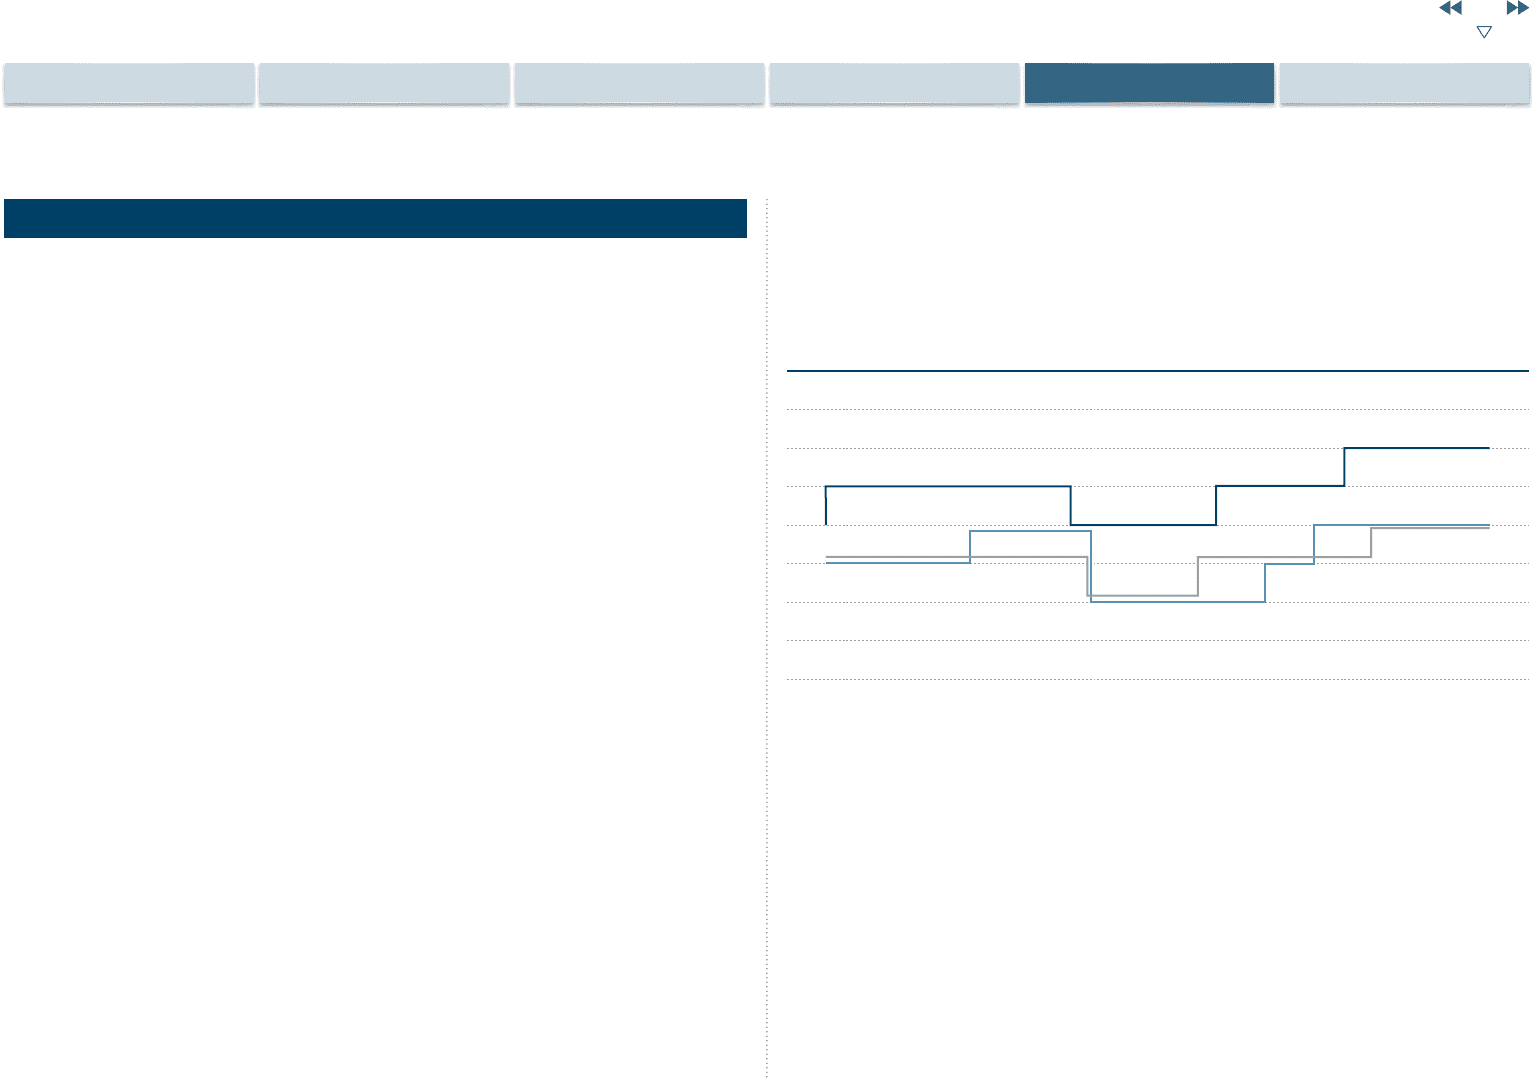
Corporate Ratings
Long-term credit rating
Nissan’s long-term credit rating with Rating & Investment Information, Inc. (R&I) is A+ with a stable
outlook. The Standard & Poor’s (S&P) long-term credit rating for Nissan is A– with a positive outlook.
Nissan’s credit rating with Moody’s is A3 with a stable outlook.
4/15 10/15 4/164/05 10/05
R&I
S&P
Moody’s
4/06 10/06 4/07 10/07 4/08 10/08 4/09 10/09 4/10 10/10 4/11 7/11 7/12 1/13 9/14
13
NISSAN MOTOR CORPORATION ANNUAL REPORT 2016
PERFORMANCE
CONTENTS
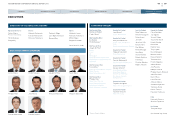
CORPORATE FACE TIME
TOP MESSAGE
NISSAN POWER 88
CORPORATE GOVERNANCE