Nissan 2016 Annual Report Download - page 13
Download and view the complete annual report
Please find page 13 of the 2016 Nissan annual report below. You can navigate through the pages in the report by either clicking on the pages listed below, or by using the keyword search tool below to find specific information within the annual report.-
 1
1 -
2
-
 3
3 -
 4
4 -
 5
5 -
 6
6 -
 7
7 -
 8
8 -
 9
9 -
 10
10 -
 11
11 -
 12
12 -
 13
13 -
 14
14 -
 15
15 -
 16
16 -
 17
17 -
 18
18 -
 19
19 -
 20
20
 |
 |
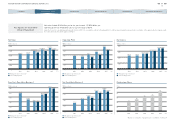
589.6
793.3
+113.3 –72.4 –24.4 –19.7 –3.4
–13.3 +223.6
545.8 523.5
605.7
498.4
718.6
793.3
589.6
935.5
710.0
860.0
2016201520142012 20132011
600
800
1,000
0
200
400
(Forecast)
(Billions of yen)
(FY)
O p e r a t i n g Profit
(Billions of yen)
341.4 342.4
389.0
457.6
523.8
600
450
300
150
0
2016201520142012 20132011
525.0
(Forecast)
(Billions of yen)
(FY)
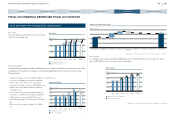
Net sales
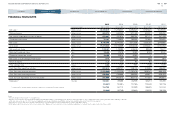
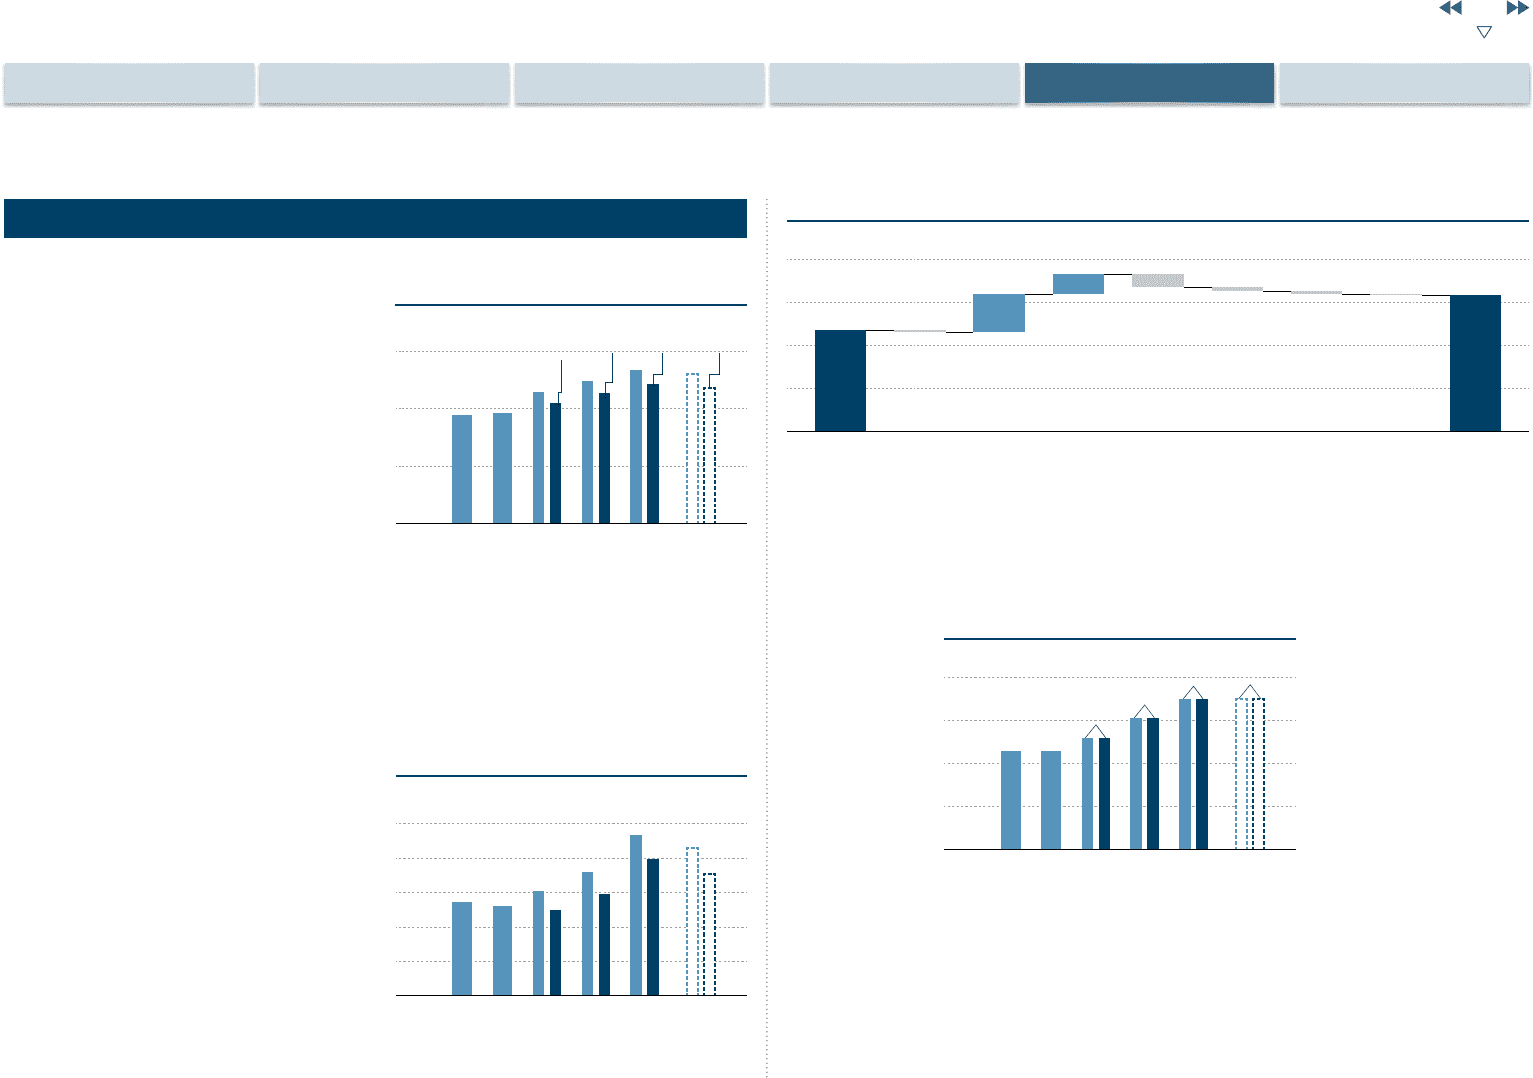
For fiscal 2015, consolidated net sales increased
7.2%, to 12.19 trillion yen.
Operating profit
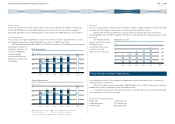
Consolidated operating profit totaled 793.3 billion yen, an increase of 34.6% from the previous fiscal year.
In comparison to the previous fiscal year’s consolidated operating profit, the variance was due to the
following factors:
l Foreign exchange rates had a negative impact of 13.3 billion yen.
l Cost items including purchasing cost reduction
efforts, lower raw material costs and product
enrichment resulted in savings of 223.6 billion yen.
l Volume and mix produced a positive impact of
113.3 billion yen.
l The increase in marketing and selling expenses
resulted in a 72.4 billion yen negative movement.
l R&D expenses increased by 24.4 billion yen.
l Manufacturing expenses increased by 19.7 billion
yen.
l Other items had a negative impact of 3.4 billion
yen.
FISCAL 2015 FINANCIAL REVIEW AND FISCAL 2016 OUTLOOK
Net income
Consolidated net income increased by 66.2 billion yen from 457.6 billion yen for the previous fiscal
year to 523.8 billion yen for the fiscal year under review.
Fiscal 2015 Financial Performance (China JV Equity Basis) Impact on Operating Profit
FY14 O.P. Cost items*
* Including purchasing cost reduction, raw material and product enrichment.
Marketing &
selling exp.
R&D exp.FOREX Volume/mix Mfg exp. Other items FY15 O.P.
Net Income
■ Management pro forma basis*
■ China JV equity basis
■ Management pro forma basis*
■ China JV equity basis
■ Management pro forma basis*
■ China JV equity basis
2016201520142012 2013
9,409.0
13,000.0
11,800.0
13,365.6
12,189.5 11,375.2
9,629.6
11,434.8
10,482.5
12,406.3
2011
0
5,000
10,000
15,000
(Forecast)
Net Sales
(Billions of yen)
(FY)
* Based on continuation of proportionate consolidation of China JV
12
NISSAN MOTOR CORPORATION ANNUAL REPORT 2016
PERFORMANCE
CONTENTS
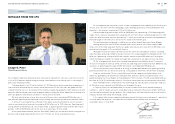
CORPORATE FACE TIME
TOP MESSAGE
NISSAN POWER 88
CORPORATE GOVERNANCE