Nissan 2016 Annual Report Download - page 12
Download and view the complete annual report
Please find page 12 of the 2016 Nissan annual report below. You can navigate through the pages in the report by either clicking on the pages listed below, or by using the keyword search tool below to find specific information within the annual report.-
 1
1 -
 2
2 -
 3
3 -
 4
4 -
 5
5 -
 6
6 -
 7
7 -
 8
8 -
 9
9 -
 10
10 -
 11
11 -
 12
12 -
 13
13 -
 14
14 -
 15
15 -
 16
16 -
 17
17 -
 18
18 -
 19
19 -
 20
20
 |
 |
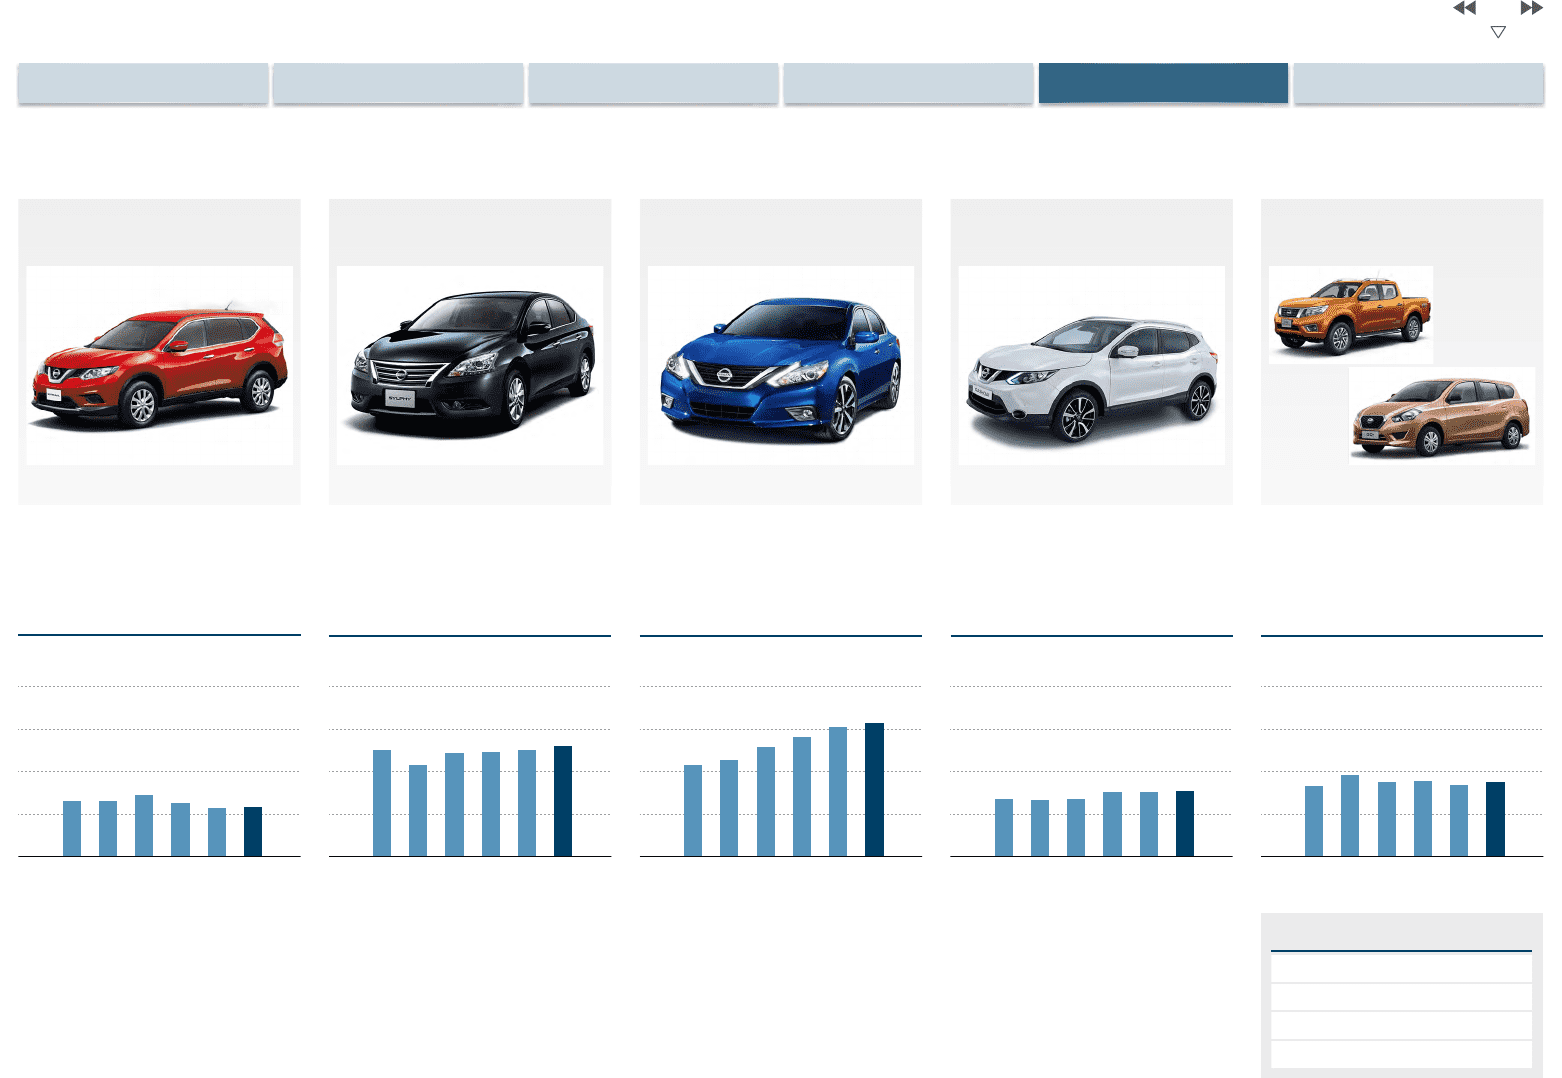
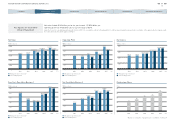
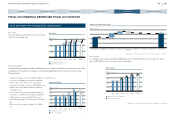
1,250*
1,247
1,080 1,216 1,222
1,300*
+4.0%
2011 2012 2013 2014 2015 2016
500
1,000
2,000
1,500
0
1,517
1,079 1,138
1,285 1,400
1,570
+3.5%
2011 2012 2013 2014 2015 2016
500
1,000
2,000
1,500
0
754
676 660 676 755
770
+2.2%
2011 2012 2013 2014 2015 2016
500
1,000
2,000
1,500
0
835
825 960 879 889 880
+5.3%
2011 2012 2013 2014 2015 2016
500
1,000
2,000
1,500
0
2011 2012 2013 2014 2015 2016
573
655 646 719 623 580
+1.3%
500
1,000
2,000
1,500
0
(Forecast)
(FY)
(Units: thousands)
(Forecast)
(FY)
(Units: thousands)
(Forecast)
(FY)
(Units: thousands)
(Forecast)
(FY)
(Units: thousands)
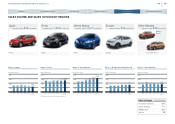
NP300
Navara
DatsunGO+PancaQashqaiAltimaSylphy
Sales in Other MarketsSales in Europe (Including Russia)Sales in United StatesSales in China
Other Markets
Total Sales Volume: 835 thousand units
Europe
Total Sales Volume: 754 thousand units
United States
Total Sales Volume: 1,517 thousand units
China
Total Sales Volume: 1,250 thousand units
X-Trail
(Forecast)
(FY)
Sales in Japan
(Units: thousands)
Japan
Total Sales Volume: 573 thousand units
SALES VOLUME AND SALES OUTLOOK BY REGIONS
* PV: Retail sales base, LCV: Wholesale base
Asia and Oceania 357
Latin America 171
Middle East 207
Africa 99
Sales by Region (Units: thousands)
11
NISSAN MOTOR CORPORATION ANNUAL REPORT 2016
PERFORMANCE
CONTENTS
CORPORATE FACE TIME
TOP MESSAGE
NISSAN POWER 88
CORPORATE GOVERNANCE