Nike 2012 Annual Report Download - page 58
Download and view the complete annual report
Please find page 58 of the 2012 Nike annual report below. You can navigate through the pages in the report by either clicking on the pages listed below, or by using the keyword search tool below to find specific information within the annual report.-
 1
1 -
2
-
3
-
4
-
5
-
6
-
7
-
8
-
9
-
10
-
11
-
12
-
13
-
14
-
15
-
16
-
17
-
18
-
19
-
20
-
21
-
22
-
23
-
24
-
25
-
26
-
27
-
28
-
29
-
30
-
31
-
32
-
33
-
34
-
35
-
36
-
37
-
38
-
39
-
40
-
41
-
42
-
43
-
44
-
45
-
46
-
47
-
 48
48 -
 49
49 -
 50
50 -
 51
51 -
 52
52 -
 53
53 -
 54
54 -
 55
55 -
 56
56 -
 57
57 -
 58
58 -
 59
59 -
 60
60 -
 61
61 -
 62
62 -
 63
63 -
 64
64 -
 65
65 -
 66
66 -
 67
67 -
 68
68 -
69
-
70
-
71
-
72
-
73
-
74
-
75
-
76
-
77
-
78
 |
 |

PART II
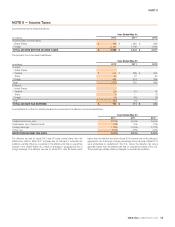
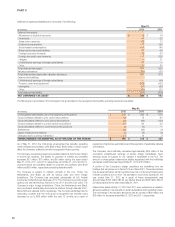
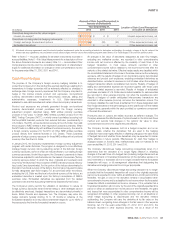
The weighted average fair value per share of the options granted during the years ended May 31, 2012, 2011, and 2010, as computed using the Black-Scholes
pricing model, was $22.15, $17.68, and $23.43, respectively. The weighted average assumptions used to estimate these fair values are as follows:
Year Ended May 31,
2012 2011 2010
Dividend yield 1.4% 1.6% 1.9%
Expected volatility 29.5% 31.5% 57.6%
Weighted average expected life (in years) 5.0 5.0 5.0
Risk-free interest rate 1.4% 1.7% 2.5%
The Company estimates the expected volatility based on the implied volatility
in market traded options on the Company’s common stock with a term
greater than one year, along with other factors. The weighted average
expected life of options is based on an analysis of historical and expected
future exercise patterns. The interest rate is based on the U.S. Treasury
(constant maturity) risk-free rate in effect at the date of grant for periods
corresponding with the expected term of the options.
The following summarizes the stock option transactions under the plan discussed above:
Shares(1)
Weighted Average
Option Price
(In millions)
Options outstanding May 31, 2009 38.8 $ 43.69
Exercised (8.6) 37.64
Forfeited (0.6) 51.92
Granted 6.4 52.79
Options outstanding May 31, 2010 36.0 $ 46.60
Exercised (7.0) 42.70
Forfeited (0.5) 58.08
Granted 6.3 69.20
Options outstanding May 31, 2011 34.8 $ 51.29
Exercised (9.0) 45.62
Forfeited (0.4) 71.04
Granted 6.8 91.74
Options outstanding May 31, 2012 32.2 $ 61.18
Options exercisable at May 31,
2010 20.4 41.16
2011 20.1 44.05
2012 17.0 $ 48.75
(1) Includes stock appreciation rights transactions.
The weighted average contractual life remaining for options outstanding and
options exercisable at May 31, 2012 was 6.3 years and 4.6 years,
respectively. The aggregate intrinsic value for options outstanding and
exercisable at May 31, 2012 was $1,512 million and $1,008 million,
respectively. The aggregate intrinsic value was the amount by which the
market value of the underlying stock exceeded the exercise price of the
options. The total intrinsic value of the options exercised during the years
ended May 31, 2012, 2011, and 2010 was $453 million, $267 million, and
$239 million, respectively.
In addition to the 1990 Plan, the Company gives employees the right to
purchase shares at a discount to the market price under employee stock
purchase plans (“ESPPs”). Employees are eligible to participate through
payroll deductions of up to 10% of their compensation. At the end of each
six-month offering period, shares are purchased by the participants at 85% of
the lower of the fair market value at the beginning or the end of the offering
period. Employees purchased 0.8 million shares during each of the three
years ended May 31, 2012, 2011 and 2010.
From time to time, the Company grants restricted stock units and restricted
stock to key employees under the 1990 Plan. The number of shares
underlying such awards granted to employees during the years ended
May 31, 2012, 2011, and 2010 were 0.4 million, 0.2 million, and 0.5 million
with weighted average values per share of $98.99, $70.23, and $53.16,
respectively. Recipients of restricted stock are entitled to cash dividends and
to vote their respective shares throughout the period of restriction. Recipients
of restricted stock units are entitled to dividend equivalent cash payments
upon vesting. The value of all grants of restricted stock and restricted stock
units was established by the market price on the date of grant. During the
years ended May 31, 2012, 2011, and 2010, the aggregate fair value of
restricted stock and restricted stock units vested was $22 million, $15 million,
and $8 million, respectively, determined as of the date of vesting.
58