Nike 2012 Annual Report Download - page 26
Download and view the complete annual report
Please find page 26 of the 2012 Nike annual report below. You can navigate through the pages in the report by either clicking on the pages listed below, or by using the keyword search tool below to find specific information within the annual report.-
 1
1 -
2
-
3
-
4
-
5
-
6
-
7
-
8
-
9
-
10
-
11
-
12
-
13
-
14
-
15
-
 16
16 -
 17
17 -
 18
18 -
 19
19 -
 20
20 -
 21
21 -
 22
22 -
 23
23 -
 24
24 -
 25
25 -
 26
26 -
 27
27 -
 28
28 -
 29
29 -
 30
30 -
 31
31 -
 32
32 -
 33
33 -
 34
34 -
 35
35 -
 36
36 -
37
-
38
-
39
-
40
-
41
-
42
-
43
-
44
-
45
-
46
-
47
-
48
-
49
-
50
-
51
-
52
-
53
-
54
-
55
-
56
-
57
-
58
-
59
-
60
-
61
-
62
-
63
-
64
-
65
-
66
-
67
-
68
-
69
-
70
-
71
-
72
-
73
-
74
-
75
-
76
-
77
-
78
 |
 |

PART II
Fiscal 2012 Compared to Fiscal 2011
Excluding changes in currency exchange rates, Greater China revenues
increased 18% for fiscal 2012, driven by continued expansion in the number
of both NIKE mono-branded stores owned by our wholesale customers and
NIKE owned stores, as well as higher comparable store sales.
Excluding changes in currency exchange rates, the growth in Greater China’s
footwear revenue for fiscal 2012 was primarily driven by double-digit
percentage growth in unit sales and a mid-single-digit growth in average unit
price per pair, reflective of product price increases. The overall increase in
footwear sales was driven by double-digit percentage growth across most
key categories, led by Running and Sportswear.
Excluding changes in currency exchange rates, the growth in Greater China’s
apparel revenues for fiscal 2012 was mainly driven by a high-single-digit
growth in the average selling price per unit and a low-single-digit percentage
increase in unit sales. The increase in average selling price was reflective of
product price increases, partially offset by higher discounts on in-line and
close-out products to accelerate the sales of slower moving apparel
inventories.
On a reported basis, revenues for Greater China increased 23% for fiscal
2012, while EBIT grew 17%, as revenue growth was partially offset by a
decline in gross margin and an increase in selling and administrative expense
as a percentage of revenues. Gross margin decreased 150 basis points for
fiscal 2012, primarily attributable to higher product input costs and discounts
on close-out products, which more than offset the favorable impact of
product price increases. Selling and administrative expense as a percentage
of revenues increased 50 basis points, driven by an increase in operating
overhead expense.
Fiscal 2011 Compared to Fiscal 2010
Excluding changes in currency exchange rates, Greater China revenues
increased 16% for fiscal 2011, driven by expansion in the number of partner-
owned stores selling NIKE products, as well as improvement in comparable
store sales for partner-owned stores.
For fiscal 2011, the increase in Greater China’s footwear revenue was
primarily driven by double-digit percentage growth in Running and
Sportswear, while the growth in apparel revenue was mainly driven by
double-digit percentage increases in Sportswear, Basketball and Men’s
Training.
For fiscal 2011, EBIT for Greater China grew at a faster rate than revenue as a
result of a higher gross margin, improved leverage on selling and
administrative expense and favorable foreign currency translation. The
improvement in gross margin was primarily attributable to higher product
prices, favorable product mix and lower inventory obsolescence expense,
which more than offset higher product input costs and warehousing costs
from our new China distribution center.
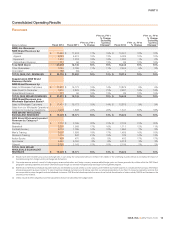
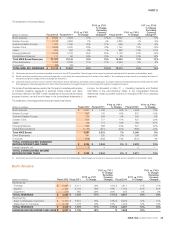
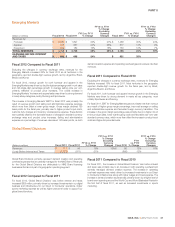
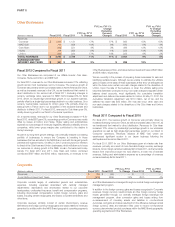
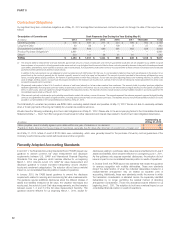
Japan
(Dollars in millions) Fiscal 2012 Fiscal 2011
FY12 vs. FY11
% Change
FY12 vs. FY11
% Change
Excluding
Currency
Changes Fiscal 2010
FY11 vs. FY10
% Change
FY11 vs. FY10
% Change
Excluding
Currency
Changes
Revenues by:
Footwear $ 438 $ 396 11% 3% $ 433 -9% -16%
Apparel 322 302 7% -1% 357 -15% -22%
Equipment 69 68 1% -4% 92 -26% -33%
TOTAL REVENUES $ 829 $ 766 8% 1% $ 882 -13% -21%
EARNINGS BEFORE INTEREST
AND TAXES $ 136 $ 114 19% $ 180 -37%
Fiscal 2012 Compared to Fiscal 2011
During fiscal 2012, the macroeconomic environment in Japan remained
uncertain as the market continued to recover from the effects of the
earthquake and tsunami in March 2011. On a currency neutral basis,
footwear revenue in Japan increased 3% for fiscal 2012, as growth in Running
and Football (Soccer) more than offset a decline in Sportswear.
Excluding changes in currency exchange rates, apparel revenue decreased
1% for fiscal 2012, as the decline in Sportswear more than offset the growth
in Running and Football (Soccer).
On a reported basis, EBIT for Japan grew at a faster rate than revenue as a
result of improved gross margin and leverage of selling and administrative
expenses. The increase in Japan’s gross margin was mainly driven by the
favorable impact from the year-over-year change in standard currency rates,
a decrease in inventory obsolescence expense as well as a lower mix of
close-out sales. These favorable impacts were partially offset by higher
product input costs.
Fiscal 2011 Compared to Fiscal 2010
On March 11, 2011, Japan experienced a major earthquake and resulting
tsunami. While the Company’s organization and assets in Japan were not
materially damaged, business results for the month of March 2011 were
significantly eroded by the natural disaster.
Excluding changes in currency exchange rates, both footwear and apparel
revenues in Japan declined, driven by decreases across most key categories.
Partially offsetting the decreases was double-digit percentage growth in
revenues from Running apparel.
The decrease in Japan’s EBIT for fiscal 2011 was primarily due to lower
revenues and higher selling and administrative expense as a percentage of
revenue, partially offset by an improvement in the gross margin percentage.
The improvement in the gross margin percentage was primarily driven by
favorable year-over-year standard currency rates and positive impacts from
fewer discounts on close-out sales, which more than offset higher product
input costs and inventory obsolescence expense.
26