Nike 2012 Annual Report Download - page 25
Download and view the complete annual report
Please find page 25 of the 2012 Nike annual report below. You can navigate through the pages in the report by either clicking on the pages listed below, or by using the keyword search tool below to find specific information within the annual report.-
 1
1 -
2
-
3
-
4
-
5
-
6
-
7
-
8
-
9
-
10
-
11
-
12
-
13
-
14
-
 15
15 -
 16
16 -
 17
17 -
 18
18 -
 19
19 -
 20
20 -
 21
21 -
 22
22 -
 23
23 -
 24
24 -
 25
25 -
 26
26 -
 27
27 -
 28
28 -
 29
29 -
 30
30 -
 31
31 -
 32
32 -
 33
33 -
 34
34 -
 35
35 -
36
-
37
-
38
-
39
-
40
-
41
-
42
-
43
-
44
-
45
-
46
-
47
-
48
-
49
-
50
-
51
-
52
-
53
-
54
-
55
-
56
-
57
-
58
-
59
-
60
-
61
-
62
-
63
-
64
-
65
-
66
-
67
-
68
-
69
-
70
-
71
-
72
-
73
-
74
-
75
-
76
-
77
-
78
 |
 |

PART II
Fiscal 2011 Compared to Fiscal 2010
On a currency neutral basis, revenues for Western Europe increased 6% for
fiscal 2011, attributable to growth in most territories. Revenues for the U.K. &
Ireland, the largest market in Western Europe, grew 5% for fiscal 2011.
Western Europe’s Direct to Consumer revenues grew 10%, which
contributed approximately 1 percentage point to Western Europe’s revenue
increase. The growth in the Direct to Consumer business was fueled by 6%
growth in comparable store sales.
Excluding changes in currency exchange rates, footwear revenue in Western
Europe increased 8%, driven by double-digit percentage growth in Running,
Football (Soccer) and Action Sports, which more than offset a slight revenue
decline in Sportswear.
On a currency neutral basis, apparel revenue in Western Europe increased
4%, primarily driven by double-digit percentage growth in Football (Soccer)
and Running, which more than offset a mid-single-digit revenue decline in
Sportswear.
For fiscal 2011, the decrease in Western Europe’s EBIT was driven by
unfavorable foreign currency translation and a lower gross margin
percentage, all of which more than offset the increase in revenues and
improved leverage on selling and administrative expense. The decline in the
gross margin percentage was significantly impacted by the unfavorable year-
over-year standard currency rates. Also contributing to the decrease in the
gross margin percentage was higher product input and air freight costs,
higher royalty expenses related to sales of endorsed team products and
higher full price discounts. These factors more than offset the favorable
impact of fewer close-out sales.
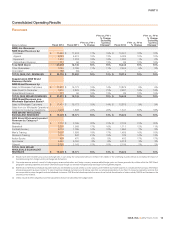
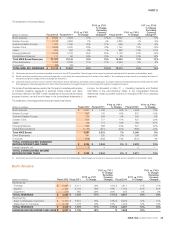
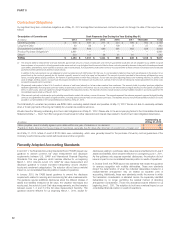
Central & Eastern Europe
(Dollars in millions) Fiscal 2012 Fiscal 2011
FY12 vs. FY11
% Change
FY12 vs. FY11
% Change
Excluding
Currency
Changes Fiscal 2010
FY11 vs. FY10
% Change
FY11 vs. FY10
% Change
Excluding
Currency
Changes
Revenues by:
Footwear $ 671 $ 605 11% 13% $ 562 8% 10%
Apparel 441 359 23% 24% 357 1% 3%
Equipment 88 76 16% 17% 80 -5% -4%
TOTAL REVENUES $ 1,200 $ 1,040 15% 17% $ 999 4% 6%
EARNINGS BEFORE INTEREST
AND TAXES $ 234 $ 244 -4% $ 249 -2%
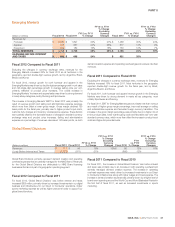
Fiscal 2012 Compared to Fiscal 2011
Excluding the changes in currency exchange rates, revenues for Central &
Eastern Europe increased 17% for fiscal 2012, driven by growth across most
territories, including double-digit growth in Russia and Turkey, which more
than offset lower revenues in Greece.
Excluding changes in currency exchange rates, Central & Eastern Europe’s
footwear revenue grew 13%, primarily driven by double-digit percentage
growth in unit sales and a low-single-digit percentage increase in average
selling price per pair. The increase in average selling price per pair was
reflective of product price increases which more than offset the negative
impact of higher discounts on in-line and close-out sales. The overall increase
in footwear sales was driven by growth across all key categories, most
notably Running, Sportswear and Football (Soccer).
Excluding changes in currency exchange rates, Central & Eastern Europe’s
apparel revenues grew 24%, mainly driven by double-digit percentage
growth in unit sales, offset by a slight decrease in average price per unit,
mainly due to less favorable product mix and higher discounts on in-line sales,
which more than offset the impact from product price increases. The overall
increase in apparel sales was primarily driven by growth in Football (Soccer),
Sportswear and Running.
On a reported basis, revenues for Central & Eastern Europe increased 15%
for fiscal 2012. However, EBIT fell 4%, primarily driven by a 420 basis point
decline in gross margin. The decline in gross margin was primarily due to
higher product input costs as well as higher discounts on in-line and close-out
products, which more than offset the favorable impact from product price
increases. Selling and administrative expense as a percentage of revenues
remained relatively flat compared to the prior period.
Fiscal 2011 Compared to Fiscal 2010
Led by Russia and Turkey, most territories within Central & Eastern Europe
reported revenue growth during fiscal 2011 as economic conditions in the
geography continued to show signs of recovery.
The growth in Central & Eastern Europe’s footwear revenues was mainly
driven by double-digit percentage growth in Football (Soccer), Running and
Action Sports, while the growth in apparel revenues was primarily driven by
double-digit percentage growth in Running.
For fiscal 2011, the decrease in Central & Eastern Europe’s EBIT was primarily
driven by unfavorable foreign currency translation and a lower gross margin
percentage, which more than offset the increase in revenues and improved
leverage on selling and administrative expense. The decline in the gross
margin percentage was primarily due to unfavorable year-over-year standard
currency rates, higher air freight costs and an increase in product input costs.
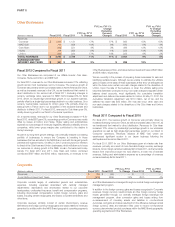
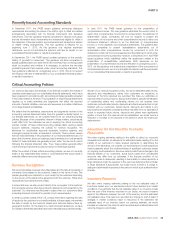
Greater China
(Dollars in millions) Fiscal 2012 Fiscal 2011
FY12 vs. FY11
% Change
FY12 vs. FY11
% Change
Excluding
Currency
Changes Fiscal 2010
FY11 vs. FY10
% Change
FY11 vs. FY10
% Change
Excluding
Currency
Changes
Revenues by:
Footwear $ 1,518 $ 1,164 30% 25% $ 953 22% 19%
Apparel 896 789 14% 9% 684 15% 13%
Equipment 125 107 17% 12% 105 2% 1%
TOTAL REVENUES $ 2,539 $ 2,060 23% 18% $ 1,742 18% 16%
EARNINGS BEFORE INTEREST
AND TAXES $ 911 $ 777 17% $ 637 22%
NIKE, INC. Š2012 Form 10-K 25