National Grid 2015 Annual Report Download - page 72
Download and view the complete annual report
Please find page 72 of the 2015 National Grid annual report below. You can navigate through the pages in the report by either clicking on the pages listed below, or by using the keyword search tool below to find specific information within the annual report.-
 1
1 -
2
-
3
-
4
-
5
-
6
-
7
-
8
-
9
-
10
-
11
-
12
-
13
-
14
-
15
-
16
-
17
-
18
-
19
-
20
-
21
-
22
-
23
-
24
-
25
-
26
-
27
-
28
-
29
-
30
-
31
-
32
-
33
-
34
-
35
-
36
-
37
-
38
-
39
-
40
-
41
-
42
-
43
-
44
-
45
-
46
-
47
-
48
-
49
-
50
-
51
-
52
-
53
-
54
-
55
-
56
-
57
-
58
-
59
-
60
-
61
-
 62
62 -
 63
63 -
 64
64 -
 65
65 -
 66
66 -
 67
67 -
 68
68 -
 69
69 -
 70
70 -
 71
71 -
 72
72 -
 73
73 -
 74
74 -
 75
75 -
 76
76 -
 77
77 -
 78
78 -
 79
79 -
 80
80 -
 81
81 -
 82
82 -
83
-
84
-
85
-
86
-
87
-
88
-
89
-
90
-
91
-
92
-
93
-
94
-
95
-
96
-
97
-
98
-
99
-
100
-
101
-
102
-
103
-
104
-
105
-
106
-
107
-
108
-
109
-
110
-
111
-
112
-
113
-
114
-
115
-
116
-
117
-
118
-
119
-
120
-
121
-
122
-
123
-
124
-
125
-
126
-
127
-
128
-
129
-
130
-
131
-
132
-
133
-
134
-
135
-
136
-
137
-
138
-
139
-
140
-
141
-
142
-
143
-
144
-
145
-
146
-
147
-
148
-
149
-
150
-
151
-
152
-
153
-
154
-
155
-
156
-
157
-
158
-
159
-
160
-
161
-
162
-
163
-
164
-
165
-
166
-
167
-
168
-
169
-
170
-
171
-
172
-
173
-
174
-
175
-
176
-
177
-
178
-
179
-
180
-
181
-
182
-
183
-
184
-
185
-
186
-
187
-
188
-
189
-
190
-
191
-
192
-
193
-
194
-
195
-
196
-
197
-
198
-
199
-
200
 |
 |

Corporate Governance
Directors’ Remuneration Report continued
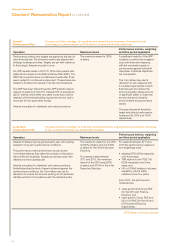
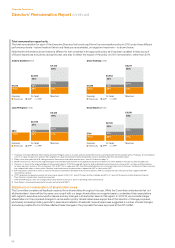
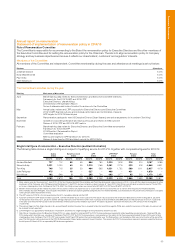
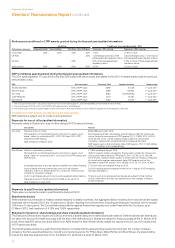
Performance against targets for APP 2014/15 (audited information)
APP awards are earned by reference to the financial year and paid in June. The APP awards earned in 2014/15 were:
Financial measures Target Actual
Proportion
of max
achieved
Proportion of salary
Andrew Bonfield Steve Holliday Tom King John Pettigrew Nick Winser
Max Actual Max Actual Max Actual Max Actual Max Actual
Adjusted EPS (p/share) 54.7 60.6 100% 43.75% 43.75% 43.75% 43.75% 43.75% 43.75% 43.75% 43.75% 43.75% 43.75%
Group RoE (%) 11.2 11.8 100% 43.75% 43.75% 43.75% 43.75% – – – – – –
UK RoE (%) 13.7 14.3 83.33% – – – – – – 43.75% 36.46% 43.75% 36.46%
US RoE (%) 9.0 8.4 0% – – – – 43.75% 0% – – – –
Individual objectives See below 37. 5% 30% 37.5% 31% 37. 5% 21% 37.5% 30.8% 37. 5% 32.5%
Tot als 125% 117.5% 125% 118.5% 125% 64.75% 125% 111.0 4% 125% 112.71%
APP awarded £854,029 £1,209,687 £484,464 £527,4 40 £205,132
1. In relation to the financial measures, threshold, target and stretch performance pays out at 0%, 50% and 100% respectively and on a straight-line basis in between threshold and target
performance and target and stretch performance.
2. Adjusted EPS is amended for the impact of timing and actuarial assumptions on pensions and OPEBs.
3. The UK RoE comprises the reported 13.7% plus a discretionary adjustment of 60bps to include the benefit of a one-off legal settlement.
4. Nick Winser’s APP award for 2014/15 is prorated to reflect the period between 1 April and 28 July 2014 when he was a member of the Board.
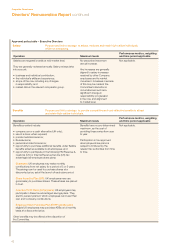
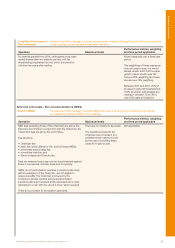
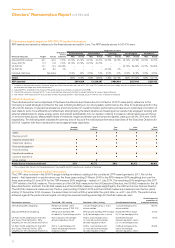
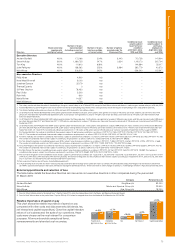
Individual objectives
The individual performance objectives of the Executive Directors and Executive Committee for 2014/15 were set by reference to the
Company’s overall strategic priorities for the year including building on our strong safety performance; the drive for business growth in the
UK and US; delivery of operational excellence and improvement in overall Company performance and service to customers; promotion of
new ideas to work more efficiently and effectively; strengthening the talent pipeline and keeping all our people fully engaged; working with
external stakeholders to shape energy policy and embed sustainability into our decision making to preserve natural resources and focus
on environmental issues. Measureable levels of threshold, target and stretch performance are agreed, paying out at 0%, 50% and 100%
respectively. The following table indicates the primary area of focus of the individual performance objectives of the Executive Directors for
2014/15, together with their overall performance against these objectives:
Andrew
Bonfield
Steve
Holliday
Tom
King
John
Pettigrew
Nick
Winser
Safety ••••
Business growth ••••
Capability development •••••
Stakeholder relations • • • •
Employee engagement •••••
Financial strategy •
Operational excellence •••••
Customer experience • •
Group strategy •
Proportion of maximum achieved: 80% 82.7% 56% 82.2% 86.6%
1. The scoring for Nick Winser is for the period between 1 April and 28 July 2014 when he was a member of the Board.
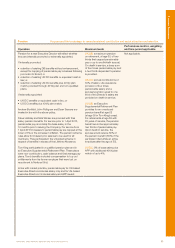
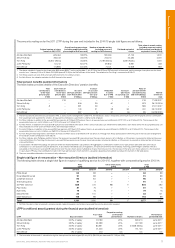
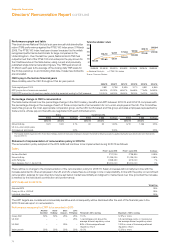
2014/15 LTPP performance (audited information)
The LTPP value included in the 2014/15 single total figure relates to vesting of the conditional LTPP award granted in 2011. Part of the
award – that dependent on performance over the three years ending 31 March 2014 for the EPS measure (50% weighting) and over the
three years ending 30 June 2014 for the TSR measure (25% weighting) – vested on 1 July 2014. The remaining 25% weighting of the 2011
LTPP relates to the RoE measure. This is made up of the UK RoE measure for the UK Executive Directors, the US RoE measure for the US
Executive Director and both the UK RoE measure and the US RoE measure in equal weightings for the CEO and Group Finance Director.
The UK RoE measure is measured over the four years ending 31 March 2015 and the US RoE measure is measured over the four years
ending 31 December 2014. However, the award does not vest until four years after the grant date, i.e. until 1 July 2015. The performance
achieved against the performance targets, including the expected vesting percentage for the RoE measures, was:
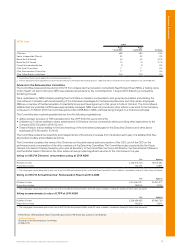
Performance measure Threshold – 25% vesting Maximum – 100% vesting Actual/expected vesting
Actual/expected
proportion of
maximum achieved
TSR ranking (25% weighting) Ranked at median of the
comparator group (FTSE 100)
7.5 percentage points or more
above median
7.33 percentage points
above median
98.3%
Adjusted EPS (50% weighting) EPS growth exceeds RPI
increase by 3 percentage points
EPS growth exceeds RPI increase
by 8 percentage points or more
Exceeded RPI increase
by 3.4 percentage points
31.0%
UK RoE (12.5% weighting for the CEO
andGroup Finance Director; 25%
weighting for the UK Executive Director)
RoE is equal to the average
allowed regulatory return
RoE is 2 percentage points
or more above the average
allowed regulatory return
Exceeded average
allowed regulatory return
by 3.1percentage points
100%
US RoE (12.5% weighting for the CEO
andGroup Finance Director; 25%
weighting for the US Executive Director)
RoE is 1 percentage point
below the average allowed
regulatory return
RoE is 1 percentage point
or more above the average
allowed regulatory return
0.98 percentage points
below the average
allowed regulatory return
25.9%
70