National Grid 2015 Annual Report Download - page 102
Download and view the complete annual report
Please find page 102 of the 2015 National Grid annual report below. You can navigate through the pages in the report by either clicking on the pages listed below, or by using the keyword search tool below to find specific information within the annual report.-
 1
1 -
2
-
3
-
4
-
5
-
6
-
7
-
8
-
9
-
10
-
11
-
12
-
13
-
14
-
15
-
16
-
17
-
18
-
19
-
20
-
21
-
22
-
23
-
24
-
25
-
26
-
27
-
28
-
29
-
30
-
31
-
32
-
33
-
34
-
35
-
36
-
37
-
38
-
39
-
40
-
41
-
42
-
43
-
44
-
45
-
46
-
47
-
48
-
49
-
50
-
51
-
52
-
53
-
54
-
55
-
56
-
57
-
58
-
59
-
60
-
61
-
62
-
63
-
64
-
65
-
66
-
67
-
68
-
69
-
70
-
71
-
72
-
73
-
74
-
75
-
76
-
77
-
78
-
79
-
80
-
81
-
82
-
83
-
84
-
85
-
86
-
87
-
88
-
89
-
90
-
91
-
 92
92 -
 93
93 -
 94
94 -
 95
95 -
 96
96 -
 97
97 -
 98
98 -
 99
99 -
 100
100 -
 101
101 -
 102
102 -
 103
103 -
 104
104 -
 105
105 -
 106
106 -
 107
107 -
 108
108 -
 109
109 -
 110
110 -
 111
111 -
 112
112 -
113
-
114
-
115
-
116
-
117
-
118
-
119
-
120
-
121
-
122
-
123
-
124
-
125
-
126
-
127
-
128
-
129
-
130
-
131
-
132
-
133
-
134
-
135
-
136
-
137
-
138
-
139
-
140
-
141
-
142
-
143
-
144
-
145
-
146
-
147
-
148
-
149
-
150
-
151
-
152
-
153
-
154
-
155
-
156
-
157
-
158
-
159
-
160
-
161
-
162
-
163
-
164
-
165
-
166
-
167
-
168
-
169
-
170
-
171
-
172
-
173
-
174
-
175
-
176
-
177
-
178
-
179
-
180
-
181
-
182
-
183
-
184
-
185
-
186
-
187
-
188
-
189
-
190
-
191
-
192
-
193
-
194
-
195
-
196
-
197
-
198
-
199
-
200
 |
 |

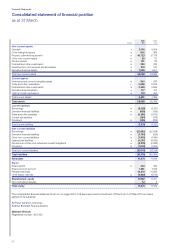
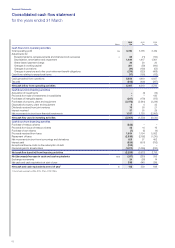
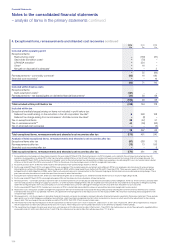
Financial Statements
– analysis of items in the primary statements continued
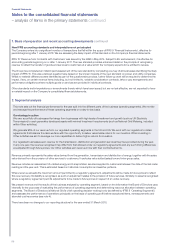
Notes to the consolidated financial statements
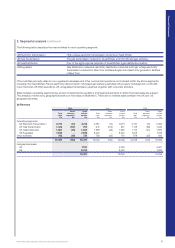
Unaudited commentary on the results of our principal operations by segment continued
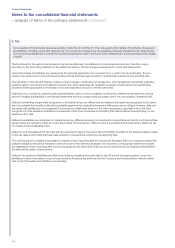
Commentary on UK regulated financial performance
The regulated financial performance calculation provides a
measure of the performance of the regulated operations before
the impacts of interest and taxation. It adjusts reported operating
profit under IFRS to reflect the impact of the businesses’
regulatory arrangements when presenting financial performance.
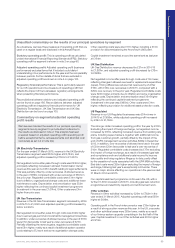
Adjustments in calculating regulatory financial performance
The principal adjustments from reported operating profit to UK
regulated financial performance are:
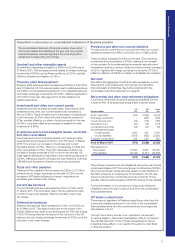
Movement in UK regulatory ‘IOUs’: Revenue related to
performance in one year may be recovered in later years. Revenue
may be recovered in one year but be required to be returned to
customers in future years. IFRS recognises these revenues when
they flow through invoices to customers and not in the period to
which they relate.
Performance RAV: UK performance efficiencies are in part
remunerated by the creation of additional RAV which is expected
to result in future earnings under regulatory arrangements.
Pension adjustment: Cash payments against pension deficits
inthe UK are recoverable under regulatory contracts.
3% RAV indexation: Future UK revenues expected to be set
using an asset base adjusted for inflation. This will be billed in
future periods and recognised under IFRS at that time.
UK deferred taxation adjustment: Future UK revenues are
expected to recover cash taxation cost including the unwinding
ofdeferred taxation balances created in the current year.
Regulatory depreciation: US and UK regulated revenues include
allowance for a return of regulatory capital in accordance with
regulatory assumed asset lives. This return does not form part
ofregulatory profit.
Fast/slow money adjustment: The regulatory remuneration
ofcosts incurred is split between in year revenue allowances
andthecreation of additional RAV. This does not align with the
classification of costs as operating costs and fixed asset additions
under IFRS accounting principles.
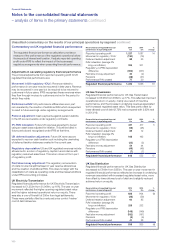
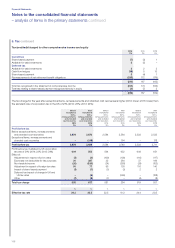
UK Electricity Transmission
Regulated financial performance for UK Electricity Transmission
increased to £1,232m from £1,066m, up 16%. The year on year
movement reflected the higher opening regulated asset value
andthe higher achieved operational return on equity. There
wasalso a one-off benefit of £56m from legal settlements.
Thesewerepartially offset by a reduced price control ‘tracker’
cost ofdebt allowance.
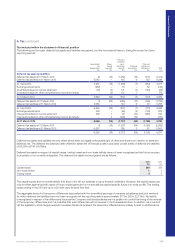
Reconciliation of regulated financial
performance to operating profit
2015
£m
2014
£m
%
change
Reported operating profit 1,237 1,087 14
Movement in regulatory ‘IOUs’ (130) (19)
Deferred taxation adjustment 88 53
RAV indexation (average 3%
long-runinflation) 326 301
Regulatory vs IFRS depreciation
difference (352) (337)
Fast/slow money adjustment 34 (2)
Pensions (48) (47)
Performance RAV created 77 30
Regulated financial performance 1,232 1,066 16
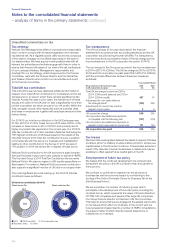
UK Gas Transmission
Regulated financial performance for UK Gas Transmission
increased to £648m from £552m, up 17%. This reflected improved
operational return on equity, mainly as a result of incentive
performance, and the increase in underlying revenues associated
with increased regulated asset value. This was partly offset by
lower allowed cost of debt (2.72% real compared with 2.92% real
in2013/14).
Reconciliation of regulated financial
performance to operating profit
2015
£m
2014
£m
%
change
Reported operating profit 437 417 5
Movement in regulatory ‘IOUs’ (16) (28)
Deferred taxation adjustment 85 12
RAV indexation (average 3%
long-runinflation) 166 162
Regulatory vs IFRS depreciation
difference (22) (2)
Fast/slow money adjustment 54 44
Pensions (49) (46)
Performance RAV created (7) (7)
Regulated financial performance 648 552 17
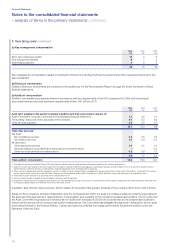
UK Gas Distribution
Regulated financial performance for UK Gas Distribution
decreased to £819m from £855m. The year on year movement in
regulated financial performance reflected an increase in underlying
revenues associated with increased regulated asset value, more
than offset by lower allowed cost of debt and a slightly reduced
achieved return on equity.
Reconciliation of regulated financial
performance to operating profit
2015
£m
2014
£m
%
change
Reported operating profit 826 904 (9)
Movement in regulatory ‘IOUs’ (28) (59)
Deferred taxation adjustment 60 85
RAV indexation (average 3%
long-runinflation) 255 252
Regulatory vs IFRS depreciation
difference (148) (149)
Fast/slow money adjustment (182) (197)
Pensions (5) (9)
Performance RAV created 41 28
Regulated financial performance 819 855 (4)
100