National Grid 2015 Annual Report Download - page 62
Download and view the complete annual report
Please find page 62 of the 2015 National Grid annual report below. You can navigate through the pages in the report by either clicking on the pages listed below, or by using the keyword search tool below to find specific information within the annual report.-
 1
1 -
2
-
3
-
4
-
5
-
6
-
7
-
8
-
9
-
10
-
11
-
12
-
13
-
14
-
15
-
16
-
17
-
18
-
19
-
20
-
21
-
22
-
23
-
24
-
25
-
26
-
27
-
28
-
29
-
30
-
31
-
32
-
33
-
34
-
35
-
36
-
37
-
38
-
39
-
40
-
41
-
42
-
43
-
44
-
45
-
46
-
47
-
48
-
49
-
50
-
51
-
 52
52 -
 53
53 -
 54
54 -
 55
55 -
 56
56 -
 57
57 -
 58
58 -
 59
59 -
 60
60 -
 61
61 -
 62
62 -
 63
63 -
 64
64 -
 65
65 -
 66
66 -
 67
67 -
 68
68 -
 69
69 -
 70
70 -
 71
71 -
 72
72 -
73
-
74
-
75
-
76
-
77
-
78
-
79
-
80
-
81
-
82
-
83
-
84
-
85
-
86
-
87
-
88
-
89
-
90
-
91
-
92
-
93
-
94
-
95
-
96
-
97
-
98
-
99
-
100
-
101
-
102
-
103
-
104
-
105
-
106
-
107
-
108
-
109
-
110
-
111
-
112
-
113
-
114
-
115
-
116
-
117
-
118
-
119
-
120
-
121
-
122
-
123
-
124
-
125
-
126
-
127
-
128
-
129
-
130
-
131
-
132
-
133
-
134
-
135
-
136
-
137
-
138
-
139
-
140
-
141
-
142
-
143
-
144
-
145
-
146
-
147
-
148
-
149
-
150
-
151
-
152
-
153
-
154
-
155
-
156
-
157
-
158
-
159
-
160
-
161
-
162
-
163
-
164
-
165
-
166
-
167
-
168
-
169
-
170
-
171
-
172
-
173
-
174
-
175
-
176
-
177
-
178
-
179
-
180
-
181
-
182
-
183
-
184
-
185
-
186
-
187
-
188
-
189
-
190
-
191
-
192
-
193
-
194
-
195
-
196
-
197
-
198
-
199
-
200
 |
 |

Corporate Governance
Directors’ Remuneration Report
Annual statement from the
Remuneration Committee chairman
Overview
Last year, over 96% of shareholders voted to approve a new
remuneration policy for National Grid. Although the policy is not
subject to shareholder vote again this year, we have reprinted it
onpages 62 to 68 for ease of reference. The new policy followed
anextensive review by the Remuneration Committee to assess
how the remuneration framework needed to change to reflect
developments in National Grid’s business – the introduction of
a new eight year regulatory framework in the UK (RIIO), and the
continued evolution of our US business.
National Grid’s shareholder returns are earned progressively
through two main contributing factors. First, through careful
management of long-term assets and their financing; and second,
by building for future returns through a substantial, continuing and
well-executed programme of long-term capital investment in
regulated and non-regulated operations. Our aim was to make sure
that shareholders’ and executives’ longer-term interests are clearly
aligned through properly focused incentive plans and by requiring
executives to have a significant shareholding in the Company. In
summary, we concluded that:
• there should be a significant weighting towards longer-term
incentives and longer-term shareholding exposure for senior
management through a reduction in the potential maximum
Annual Performance Plan (APP) level, and an increase in the
potential maximum Long Term Performance Plan (LTPP) level;
• the bulk of remuneration should be paid in National Grid shares;
• senior executives should be required to have a significant
mandatory shareholding (500% of pre-tax salary for the CEO
and 400% for other Executive Directors) and that no shares
could be sold (except for meeting the tax on vesting) until the
mandatory shareholding level was attained;
• shares that vested under the LTPP, following the three year
performance measurement period, had to be retained for
afurther two years, irrespective of whether the mandatory
shareholding level had been attained; and
• the metrics for LTPP performance should change to Return on
Equity (RoE) and value growth. RoE provides a measurement
of management’s performance in generating profit from the
business, and value growth captures management’s longer-term
performance in creating shareholder value.
We were clear that the new arrangements must only deliver higher
rewards when executives had achieved a commensurately stronger
performance. We believe that we have set threshold, target and
stretch levels of performance accordingly. We also wanted to make
sure that our commitment to increasing the annual dividend by at
least RPI for the foreseeable future – an important element in
shareholders’ total return – was linked to executive remuneration.
The Committee, therefore, made it explicit that it had the power to
reduce LTPP vesting if the Company failed to honour the dividend
commitment, irrespective of the level of vesting resulting from the
performance against the LTPP targets set by the Committee.
The Remuneration Committee believes that the policy endorsed
last year by shareholders is fully aligned with the Company’s
strategy and with the experience of shareholders in general.
Italsobelieves that, based on our appraisal of performance
againstour demanding targets to date, the policy is not inflationary
compared with previous arrangements. We will, however, continue
to reassess remuneration policy and targets for future awards so
that we can remain confident they are still meeting the objectives
set by the Committee.
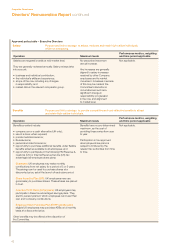
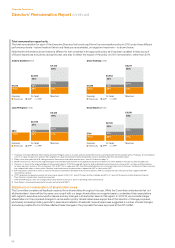
Performance for the year
APP
National Grid has achieved another year of strong financial
performance in the UK and solid performance in the US with
record investment levels. The financial measures for the APP were
adjusted EPS and either Group RoE, UK or US RoE depending
onrole. At 60.6 pence, the adjusted EPS figure for APP was up
6.3pence (12%) on 2013/14. The EPS figure used for the APP
calculation differs slightly to the reported EPS figure of 58.1 pence
as it is adjusted for the impact of timing and actuarial assumptions
on pensions and other post-employment benefits (OPEB). Group
RoE was 11.8%, ahead of last year’s 11.4% result. Our UK RoE was
14.3%, including the benefit of a legal settlement referred to in the
report of the Audit Committee on page 52. In the US, our RoE was
8.4%, which was slightly down on last year. As a result, in respect
offinancial metrics for the APP (representing 70% of the value of
the award), we have made awards of between 50% and 100% of
the maximum potential to the Executive Directors. The balance of
the APP award is represented by performance against personal
objectives set by the Remuneration Committee. As a result, we
have made APP awards to the Executive Directors of between 64%
and 119% of salary. Details of each Executive Director’s APP award
are set out on page70. This is the first year ofthe new policy for
maximum APP payments, with the maximum being reduced from
150% of salary (for the 2013/14 awards) to125%.
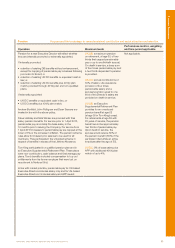
LTPP
2014 was the first year in which the maximum potential for the
LTPP awarded during the year was increased in line with the new
remuneration policy from 225% to 350% of salary for the Chief
Executive and 200% to 300% of salary for the other Executive
Directors. This is a three year plan and the performance
outcomeswill only be determined in July 2017. In 2014/15, Group
RoE and value growth were both on target in relation to the 2014
LTPP parameters, with UK RoE around stretch, and US RoE
belowthreshold.
The LTPP that vested during 2014/15 was that awarded in 2011.
This included three performance measures: adjusted EPS;
relativetotal shareholder return (TSR); and UK and US returns.
TheEPS measure vested at 31%, reflecting EPS growth just above
the threshold target for this measure. The TSR measure vested at
98.3%, which reflects an annualised return to shareholders of
18.9% over the period. The UK and US returns measures are
expected to vest at 100% and 25.9% respectively, reflecting strong
operational performance in the UK, including the first two years of
RIIO, and the impact of rate base growth and higher winter related
costs in the US. As a result, the 2011 LTPP vested at between
46%and 66% for the Executive Directors. Details of each Executive
Director’s vested LTPP are setout on pages 70 and 71.
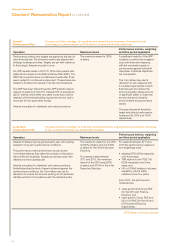
Future targets
Details of future targets and historical performance are disclosed
each year in respect of the LTPP. Details of historical performance
against targets are disclosed each year in respect of the APP.
Weprovide these details on pages 70 to 72 and page 74. Taking
account of this year’s performance, as well as the challenges
Jonathan Dawson
Committee chairman
60