National Grid 2015 Annual Report Download - page 118
Download and view the complete annual report
Please find page 118 of the 2015 National Grid annual report below. You can navigate through the pages in the report by either clicking on the pages listed below, or by using the keyword search tool below to find specific information within the annual report.-
 1
1 -
2
-
3
-
4
-
5
-
6
-
7
-
8
-
9
-
10
-
11
-
12
-
13
-
14
-
15
-
16
-
17
-
18
-
19
-
20
-
21
-
22
-
23
-
24
-
25
-
26
-
27
-
28
-
29
-
30
-
31
-
32
-
33
-
34
-
35
-
36
-
37
-
38
-
39
-
40
-
41
-
42
-
43
-
44
-
45
-
46
-
47
-
48
-
49
-
50
-
51
-
52
-
53
-
54
-
55
-
56
-
57
-
58
-
59
-
60
-
61
-
62
-
63
-
64
-
65
-
66
-
67
-
68
-
69
-
70
-
71
-
72
-
73
-
74
-
75
-
76
-
77
-
78
-
79
-
80
-
81
-
82
-
83
-
84
-
85
-
86
-
87
-
88
-
89
-
90
-
91
-
92
-
93
-
94
-
95
-
96
-
97
-
98
-
99
-
100
-
101
-
102
-
103
-
104
-
105
-
106
-
107
-
 108
108 -
 109
109 -
 110
110 -
 111
111 -
 112
112 -
 113
113 -
 114
114 -
 115
115 -
 116
116 -
 117
117 -
 118
118 -
 119
119 -
 120
120 -
 121
121 -
 122
122 -
 123
123 -
 124
124 -
 125
125 -
 126
126 -
 127
127 -
 128
128 -
129
-
130
-
131
-
132
-
133
-
134
-
135
-
136
-
137
-
138
-
139
-
140
-
141
-
142
-
143
-
144
-
145
-
146
-
147
-
148
-
149
-
150
-
151
-
152
-
153
-
154
-
155
-
156
-
157
-
158
-
159
-
160
-
161
-
162
-
163
-
164
-
165
-
166
-
167
-
168
-
169
-
170
-
171
-
172
-
173
-
174
-
175
-
176
-
177
-
178
-
179
-
180
-
181
-
182
-
183
-
184
-
185
-
186
-
187
-
188
-
189
-
190
-
191
-
192
-
193
-
194
-
195
-
196
-
197
-
198
-
199
-
200
 |
 |

Financial Statements
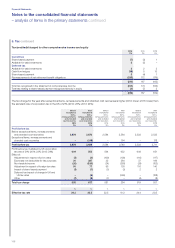
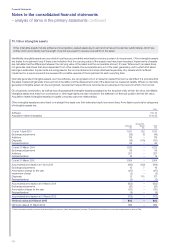
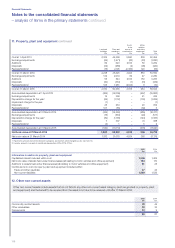
11. Property, plant and equipment continued
Land and
buildings
£m
Plant and
machinery
£m
Assets
in the
course of
construction
£m
Motor
vehicles
and office
equipment
£m
Total
£m
Cost at 1 April 2013 2,325 45,366 3,960 803 52,454
Exchange adjustments (99) (1,471) (82) (28) (1,680)
Additions 69 623 2,514 56 3,262
Disposals (32) (288) (2) (98) (420)
Reclassifications1(15) 2,195 (2,366) 120 (66)
Cost at 31 March 2014 2,248 46,425 4,024 853 53,550
Exchange adjustments 132 2,019 82 47 2,280
Additions 55 544 2,514 150 3,263
Disposals (30) (334) (1) ( 74) (439)
Reclassifications1105 1,981 (2,10 4) 8(10)
Cost at 31 March 2015 2,510 50,635 4,515 984 58,644
Accumulated depreciation at 1 April 2013 (499) (14,806) –(557) (15,862)
Exchange adjustments 16 399 –21 436
Depreciation charge for the year2(84) (1,112) –(103) (1,299)
Impairment charge for the year (1) –––(1)
Disposals 25 234 –93 352
Reclassifications1107 (65) –(39) 3
Accumulated depreciation at 31 March 2014 (436) (15,350) –(585) (16,371)
Exchange adjustments (15) (533) –(29) (577)
Depreciation charge for the year2(82) (1,13 8) –(143) (1,363)
Disposals 7307 –74 388
Reclassifications1(4) 1 – 5 2
Accumulated depreciation at 31 March 2015 (530) (16,713) –(678) (17,9 21)
Net book value at 31 March 2015 1,980 33,922 4,515 306 40,723
Net book value at 31 March 2014 1,812 31,075 4,024 268 37,179
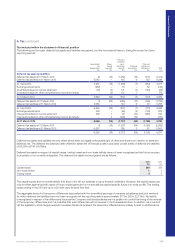
1. Represents amounts transferred between categories and (to)/from other intangible assets (see note 10).
2. Includes amounts in respect of capitalised depreciation of £2m (2014: £10m).
2015
£m
2014
£m
Information in relation to property, plant and equipment
Capitalised interest included within cost 1,506 1,409
Net book value of assets held under finance leases (all relating to motor vehicles and office equipment) 184 170
Additions to assets held under finance leases (all relating to motor vehicles and office equipment) 61 25
Contributions to cost of property, plant and equipment included within:
Trade and other payables 47 44
Non-current liabilities 1,569 1,526
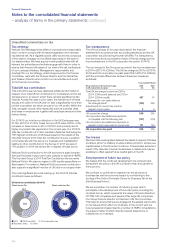
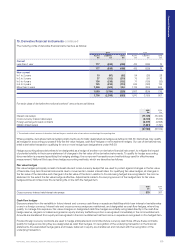
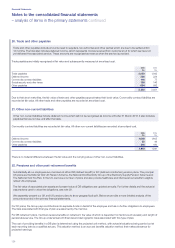
12. Other non-current assets
Other non-current assets include assets that do not fall into any other non-current asset category (such as goodwill or property, plant
and equipment) and the benefit to be received from the asset is not due to be received until after 31 March 2016.
2015
£m
2014
£m
Commodity contract assets 29 45
Other receivables 39 33
Prepayments 12 9
80 87
– analysis of items in the primary statements continued
Notes to the consolidated financial statements
116