National Grid 2015 Annual Report Download - page 22
Download and view the complete annual report
Please find page 22 of the 2015 National Grid annual report below. You can navigate through the pages in the report by either clicking on the pages listed below, or by using the keyword search tool below to find specific information within the annual report.-
 1
1 -
2
-
3
-
4
-
5
-
6
-
7
-
8
-
9
-
10
-
11
-
 12
12 -
 13
13 -
 14
14 -
 15
15 -
 16
16 -
 17
17 -
 18
18 -
 19
19 -
 20
20 -
 21
21 -
 22
22 -
 23
23 -
 24
24 -
 25
25 -
 26
26 -
 27
27 -
 28
28 -
 29
29 -
 30
30 -
 31
31 -
 32
32 -
33
-
34
-
35
-
36
-
37
-
38
-
39
-
40
-
41
-
42
-
43
-
44
-
45
-
46
-
47
-
48
-
49
-
50
-
51
-
52
-
53
-
54
-
55
-
56
-
57
-
58
-
59
-
60
-
61
-
62
-
63
-
64
-
65
-
66
-
67
-
68
-
69
-
70
-
71
-
72
-
73
-
74
-
75
-
76
-
77
-
78
-
79
-
80
-
81
-
82
-
83
-
84
-
85
-
86
-
87
-
88
-
89
-
90
-
91
-
92
-
93
-
94
-
95
-
96
-
97
-
98
-
99
-
100
-
101
-
102
-
103
-
104
-
105
-
106
-
107
-
108
-
109
-
110
-
111
-
112
-
113
-
114
-
115
-
116
-
117
-
118
-
119
-
120
-
121
-
122
-
123
-
124
-
125
-
126
-
127
-
128
-
129
-
130
-
131
-
132
-
133
-
134
-
135
-
136
-
137
-
138
-
139
-
140
-
141
-
142
-
143
-
144
-
145
-
146
-
147
-
148
-
149
-
150
-
151
-
152
-
153
-
154
-
155
-
156
-
157
-
158
-
159
-
160
-
161
-
162
-
163
-
164
-
165
-
166
-
167
-
168
-
169
-
170
-
171
-
172
-
173
-
174
-
175
-
176
-
177
-
178
-
179
-
180
-
181
-
182
-
183
-
184
-
185
-
186
-
187
-
188
-
189
-
190
-
191
-
192
-
193
-
194
-
195
-
196
-
197
-
198
-
199
-
200
 |
 |

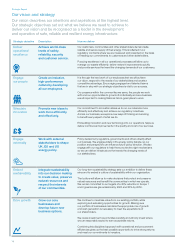
Strategic Report
Financial review
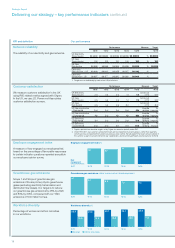
Additional commentary on financial KPIs
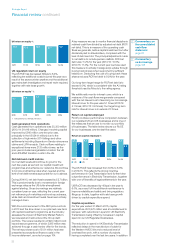
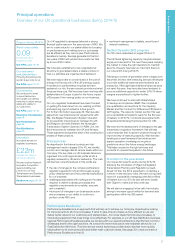
Adjusted operating profit
Adjusted operating profit for the year ended
31March 2015 was £3,863 million, up £199 million
(5%) from last year. With the exception of our UK Gas
Distribution business, we saw increases in operating
profit in all of our business segments.
UK Electricity
Transmission
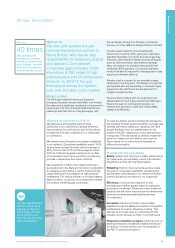
UK Gas
Transmission
UK Gas
Distribution
US
Regulated
Other
activities
+14%
+5%
-9%
+3%
+52%
Adjusted operating profit by segment
£m
1,237
437
826
1,164
199
For the year ended 31 March 2015, adjusted
operating profit in the UK Electricity Transmission
segment increased by £150 million. Net regulated
income after pass-through costs was £230 million
higher, principally reflecting increases in allowed
transmission owner revenues this year and a
£43million benefit relating to legal settlements.
Thiswas partially offset by under-recoveries of
allowed revenue in the year of £89 million compared
with under-recoveries of £60 million in the prior year.
Regulated controllable costs were £14 million higher
due to inflation, organisational change costs and
additional tower maintenance costs. Depreciation
and amortisation was £33 million higher reflecting
thecontinued capital investment programme, and
other costs were £4 million higher than prior year.
UK Gas Transmission adjusted operating profit
increased by £20 million to £437 million. Net
regulated income after pass-through costs was
£42million higher due to earned gas permit and
constraint management incentives. In addition,
under-recoveries of allowed revenue in the year of
£18 million were £3 million favourable to last year’s
under-recoveries of £21 million. Partially offsetting
the revenue gains, regulated controllable costs
were£8 million higher, including additional system
operator costs relating to EU work. Other operating
costs were also £17million higher, including
decommissioning costs of the Avonmouth LNG plant.
UK Gas Distribution adjusted operating profit
decreased to £826 million from £904 million in
2013/14. Net regulated income after pass-through
costs was £11 million lower, reflecting changes in
allowed revenues for repex expenditure. Timing
differences reduced net revenues by a further
£16million, with £13 million over-recoveries in
2014/15 compared with a £29 million over-recovery
in the prior year. Regulated controllable costs were
£22million higher primarily due to inflation and
organisational change costs. Depreciation and
amortisation was £15 million higher reflecting the
continued capital investment programme, and other
costs were £14 million higher than prior year, including
provision for additional asset protection costs.
Within our US Regulated businesses, adjusted
operating profit increased by £39 million to
£1,164million. The stronger dollar increased operating
profit in the year by £30 million. Excluding the impact of
foreign exchange, net regulated income increased by
£81 million, reflecting increased revenue allowances
under the Niagara Mohawk three year rate plan and
other regulated revenue increases, partially offset by
the impact of the end of LIPA management services
agreement (MSA) in December 2013. In addition,
over-recoveries of allowed revenues in the year of
£30million were £20 million favourable to last year’s
over-recoveries of £10 million. Regulated controllable
costs increased by £17 million excluding the impact
offoreign exchange, as a result of increased gas leak
and compliance work and additional costs incurred
toimprove data quality to bring regulatory filings up
todate. This was partly offset by the removal of costs
associated with the LIPA MSA activities. Following last
year’s exceptionally cold winter, bad debt costs were
£62million higher excluding the impact of foreign
exchange. There were no major storms affecting our
operations in the years ended 31 March 2014 and 2015.
Adjusted operating profit in Other activities was
£68million higher at £199 million. Operating profit in
the French interconnector was £18 million higher as a
result of strong auction revenues this year. In the US,
corporate and other activities losses were £63 million
lower, mainly as a result of the completion of the
enterprise resource planning system stabilisation
inthe first half of the year.
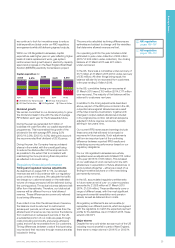
Adjusted earnings
For the year ended 31 March 2015, adjusted net
finance costs were £75 million lower than 2013/14
at£1,033 million, mainly as a result of lower average
gross debt through the year, lower RPI rates in the
UKand refinancing debt at lower rates.
The adjusted tax charge was £114 million higher
than2013/14. This was mainly due to higher profits
beforetax and the non-recurrence of one-off items
that benefited the prior year. As a result of this,
theeffective tax rate for 2014/15 was 24.2%
(2013/14:22.5%).
The earnings performance described above has
translated into adjusted earnings of £2,189 million,
up£174 million on last year. This equates to adjusted
earnings per share (EPS) of 58.1 pence, up 4.6 pence
(9%) on2013/14.
Scrip restatement
In accordance with IAS 33, all EPS and adjusted EPS
amounts for comparative periods have been restated
as a result of shares issued via scrip dividends.
Measurement of financial performance
We describe and explain our results principally on
anadjusted basis and explain the rationale for this
onpage 186. We present results on an adjusted
basisbefore exceptional items, remeasurements
andstranded cost recoveries. See page 186 for
further details and reconciliations from the adjusted
profit measures to IFRS, under which we report
ourfinancial results and position.
We have delivered another year of strong financial performance
in the UK and solid performance in the US with record
investment levels.
Use of adjusted
profit measures
page 186
Commentary on
the consolidated
income statement
page 87
Commentary
on results of
our principal
operations
by segment
pages 99–100
20