National Grid 2005 Annual Report Download - page 51
Download and view the complete annual report
Please find page 51 of the 2005 National Grid annual report below. You can navigate through the pages in the report by either clicking on the pages listed below, or by using the keyword search tool below to find specific information within the annual report.-
 1
1 -
2
-
3
-
4
-
5
-
6
-
7
-
8
-
9
-
10
-
11
-
12
-
13
-
14
-
15
-
16
-
17
-
18
-
19
-
20
-
21
-
22
-
23
-
24
-
25
-
26
-
27
-
28
-
29
-
30
-
31
-
32
-
33
-
34
-
35
-
36
-
37
-
38
-
39
-
40
-
 41
41 -
 42
42 -
 43
43 -
 44
44 -
 45
45 -
 46
46 -
 47
47 -
 48
48 -
 49
49 -
 50
50 -
 51
51 -
 52
52 -
 53
53 -
 54
54 -
 55
55 -
 56
56 -
 57
57 -
 58
58 -
 59
59 -
 60
60 -
 61
61
 |
 |

NOTES TO CONSOLIDATED FINANCIAL STATEMENTS (continued)
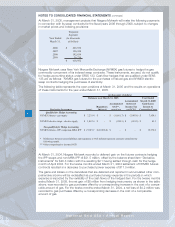
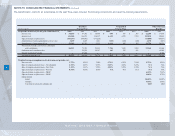
The following table provides a reconciliation of the changes in the Plans’ fair benefit obligations for the fiscal years 2005 and 2004, accumulated benefit obliga-
tion for the pension plans at March 31, and the assumption used in developing the obligations.
51
National Grid USA / Annual Report
(in thousands)
2005 2004 2005 2004 2005 2004
Accumulated benefit obligation 2,409,544$ 2,373,523$ 111,044$ 110,807$ N/A N/A
Change in benefit obligation:
Beginning balance, April 1, 2,609,731$ 2,441,307$ 114,190$ 113,805$ 1,834,258$ 1,585,462$
Service cost 50,656 47,342 690 647 22,200 17,930
Interest cost 144,100 146,273 6,149 6,578 103,810 98,849
Actuarial los s es 112,221 164,137 1,762 2,948 9,435 199,684
Plan amendments 31,201 - - - 146,689 (8,121)
Benefit payments (252,253) (144,292) (8,995) (8,399) (97,383) (85,203)
Settlements - (133,073) (1,057) (1,389) - -
Curtailments - (3,818) - - - 16,721
Special termination benefits - 91,855 - - - 8,936
Ending balance, March 31, 2,695,656$ 2,609,731$ 112,739$ 114,190$ 2,019,009$ 1,834,258$
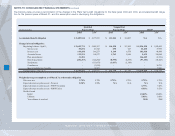
Weighted average assumptions as of March 31, to determine obligation
Discount rate 5.75% 5.75% 5.75% 5.75% 5.75% 5.75%
Expected return on plan assets - Pension 8.50% 8.50% N/A N/A N/A N/A
Expected return on plan assets - PBOP Nonunion 6.75% 7.25%
Expected return on plan assets - PBOP Union 8.50% 8.75%
Medical trend
Initial 10.00% 10.00%
Ultimate 5.00% 5.00%
Year ultimate is reached 2010 2009
PBOP
Pension Plans
Qualified
Nonqualified
Pension Plans