National Grid 2005 Annual Report Download - page 50
Download and view the complete annual report
Please find page 50 of the 2005 National Grid annual report below. You can navigate through the pages in the report by either clicking on the pages listed below, or by using the keyword search tool below to find specific information within the annual report.-
 1
1 -
2
-
3
-
4
-
5
-
6
-
7
-
8
-
9
-
10
-
11
-
12
-
13
-
14
-
15
-
16
-
17
-
18
-
19
-
20
-
21
-
22
-
23
-
24
-
25
-
26
-
27
-
28
-
29
-
30
-
31
-
32
-
33
-
34
-
35
-
36
-
37
-
38
-
39
-
 40
40 -
 41
41 -
 42
42 -
 43
43 -
 44
44 -
 45
45 -
 46
46 -
 47
47 -
 48
48 -
 49
49 -
 50
50 -
 51
51 -
 52
52 -
 53
53 -
 54
54 -
 55
55 -
 56
56 -
 57
57 -
 58
58 -
 59
59 -
 60
60 -
61
 |
 |

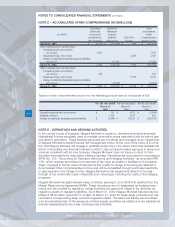
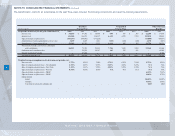
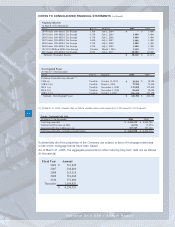
NOTES TO CONSOLIDATED FINANCIAL STATEMENTS (continued)
The following benefit payments and subsidies, which reflect expected future service, as appropriate, are expected to be paid from the Company’s plans.
50
National Grid USA / Annual Report
(in thousands)
Payments Subsidies Payments Subsidies Payments Subsidies
2006 195,000$ -$ 9,000$ -$ 100,000$ -$
2007 190,000 - 9,000 - 105,000 8,000
2008 185,000 - 9,000 - 108,000 8,800
2009 184,000 - 9,000 - 110,000 9,400
2010 192,000 - 9,000 - 111,000 9,900
2011 - 2015 1,085,000 - 46,000 - 558,000 55,000
PBOP
Pension Plans
Qualified
Nonqualified
Pension Plans