Mitsubishi 2013 Annual Report Download - page 11
Download and view the complete annual report
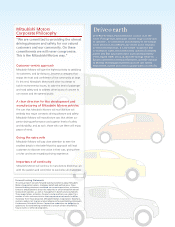
Please find page 11 of the 2013 Mitsubishi annual report below. You can navigate through the pages in the report by either clicking on the pages listed below, or by using the keyword search tool below to find specific information within the annual report.-
 1
1 -
 2
2 -
 3
3 -
 4
4 -
 5
5 -
 6
6 -
 7
7 -
 8
8 -
 9
9 -
 10
10 -
 11
11 -
 12
12 -
 13
13 -
 14
14 -
 15
15 -
 16
16 -
 17
17 -
 18
18 -
 19
19 -
 20
20 -
 21
21 -
 22
22 -
23
-
24
-
25
-
26
-
27
-
28
-
29
-
30
-
31
-
32
-
33
-
34
-
35
-
36
-
37
-
38
-
39
-
40
-
41
-
42
-
43
-
44
-
45
-
46
-
47
-
48
-
49
-
50
-
51
-
52
-
53
-
54
-
55
-
56
-
57
-
58
-
59
-
60
-
61
-
62
-
63
-
64
-
65
-
66
 |
 |

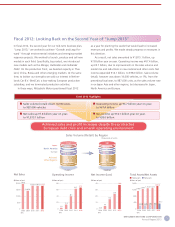
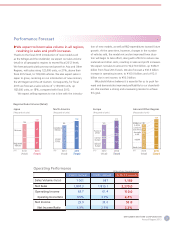
Operating Performance
FY2011 (Actual) FY2012 (Actual) FY2013 (Forecast)
Sales Volume (Retail) 1,001 987 1,169
Net Sales 1,807.3 1,815.1 2,270.0
Operating Income 63.7 67.4 100.0
Operating Income Ratio
3.5% 3.7% 4.4%
Net Income 23.9 38.0 50.0
Net Income Ratio 1.3% 2.1% 2.2%
F
Y
201
1
(
Actual
)
F
Y
20
1
2
(
Actual
)
FY2013
(
Forecast
)
Sa
le
s
Vo
lu
me
(
Retail
)
1
,
00
1
98
7
1,
169
Net Sales
1,
807.
3
1,
815.
1
2,
2
7
0
.
0
Operatin
g
Income 6
3
.7
67
.
4
10
0.
0
O
pe
rati
ng
Income Ratio
3.
5
%
3.
7
%
4
.4%
Ne
t
I
ncome
23
.9
38
.0
50
.
0
Net Income Rat
i
o
1
.3
%
2.
1
%
2
.
2%
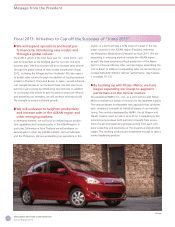
X We expect to boost sales volume in all regions,
resulting in sales and pro t increases.
Thanks to the scal 2013 introduction of new models such
as the Mirage and the Outlander, we expect our sales volume
(retail) in all geographic regions to exceed scal 2012 levels.
We forecast particularly pronounced growth in Asia and Other
Regions, with sales rising 122,000 units, or 21%, above their
scal 2012 level, to 709,000 vehicles. We also expect sales in
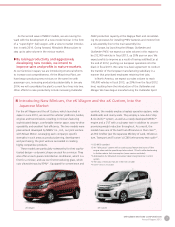
Japan to grow, centering on our introduction of new minicars,
the eK Wagon and the eK Custom. Consequently, for scal
2013 we forecast a sales volume of 1,169,000 units, up
182,000 units, or 18%, compared with scal 2012.
We expect selling expenses to rise in line with the introduc-
tion of new models, as well as R&D expenditures toward future
growth. At the same time, however, changes in the number
of vehicles sold, the model mix and an improved forex situa-
tion will begin to take effect, along with efforts to reduce raw
materials and other costs, resulting in sales and pro t increases.
We expect net sales to amount to ¥2,270.0 billion, up ¥454.9
billion from scal 2012 levels. We also forecast a ¥32.6 billion
increase in operating income, to ¥100.0 billion; and a ¥12.0
billion rise in net income, to ¥50.0 billion.
Mitsubishi Motors believes it is essential for us to push for-
ward and demonstrate improved pro tability to our sharehold-
ers. We maintain a strong and unwavering resolve to achieve
this goal.
2013
(Target)
2012
(Actual)
Japan
Regional Sales Volume (Retail)
(Thousands of units)
(FY)
(Thousands of units)
(FY)
(Thousands of units)
(FY)
(Thousands of units)
(FY)
Registered
Vehicles
Minicars
2013
(Target)
2012
(Actual)
North America
United
States
Canada &
Mexico
2013
(Target)
2012
(Actual)
Europe
Western
Europe
Central
Europe
Russia &
others
2013
(Target)
2012
(Actual)
Asia and Other Regions
North Asia
ASEAN
Australia
& NZ
Central and
South America
Middle East
& Africa
134
73
61
87
61
85
57
28
100
64
36
181
88
15
78
212
98
16
98
587
71
71
95
64
286
709
84
106
75
331
113
148
Performance Forecast
(Billions of yen, thousands of units)
MITSUBISHI MOTORS CORPORATION
Annual Report 2013 9