Marks and Spencer 2016 Annual Report Download - page 20
Download and view the complete annual report
Please find page 20 of the 2016 Marks and Spencer annual report below. You can navigate through the pages in the report by either clicking on the pages listed below, or by using the keyword search tool below to find specific information within the annual report.-
 1
1 -
2
-
3
-
4
-
5
-
6
-
7
-
8
-
9
-
 10
10 -
 11
11 -
 12
12 -
 13
13 -
 14
14 -
 15
15 -
 16
16 -
 17
17 -
 18
18 -
 19
19 -
 20
20 -
 21
21 -
 22
22 -
 23
23 -
 24
24 -
 25
25 -
 26
26 -
 27
27 -
 28
28 -
 29
29 -
 30
30 -
31
-
32
-
33
-
34
-
35
-
36
-
37
-
38
-
39
-
40
-
41
-
42
-
43
-
44
-
45
-
46
-
47
-
48
-
49
-
50
-
51
-
52
-
53
-
54
-
55
-
56
-
57
-
58
-
59
-
60
-
61
-
62
-
63
-
64
-
65
-
66
-
67
-
68
-
69
-
70
-
71
-
72
-
73
-
74
-
75
-
76
-
77
-
78
-
79
-
80
-
81
-
82
-
83
-
84
-
85
-
86
-
87
-
88
-
89
-
90
-
91
-
92
-
93
-
94
-
95
-
96
-
97
-
98
-
99
-
100
-
101
-
102
-
103
-
104
-
105
-
106
-
107
-
108
-
109
-
110
-
111
-
112
-
113
-
114
-
115
-
116
-
117
-
118
-
119
-
120
-
121
-
122
-
123
-
124
-
125
-
126
-
127
-
128
-
129
-
130
-
131
-
132
 |
 |

18
MARKS AND SPENCER GROUP PLC
STRATEGIC REPORT
OUR PERFORMANCE
KEY PERFORMANCE
INDICATORS
GROUP REVENUE
Defi nition Total Group sales, including
retail sales for owned businesses and
wholesale sales to franchise partners.
Performance Group revenues
were slightly up this year mainly
driven by the strong performance
in our Food business.
Performance Underlying PBT grew
as a result of good growth in the UK
business, from increases in both
Food and Clothing & Home profi t
and tight cost control, although this
was partly o set by a fall in profi t in
our International business.
UNDERLYING GROUP PROFIT BEFORE TAX
Defi nition Underlying profi t provides
additional information on performance,
adjusting for income and signifi cant
one-o charges.
RETURN ON CAPITAL EMPLOYED (ROCE)
Defi nition Return on capital employed
is a relative profi t measure of the
returns from net operating assets.
Performance The increase in ROCE
from last year primarily refl ects the
increase in underlying earnings
before interest and tax as well as
a small decrease in the average
net operating assets.
UNDERLYING EARNINGS PER SHARE
Defi nition Earnings per Share (EPS)
is the underlying profi t divided by
the average number of ordinary
shares in issue.
Performance The increase in
underlying EPS is a result of the
increase in underlying profi t.
The weighted average number of
shares in issue during the period
was broadly fl at year-on-year, at
1635.9m (last year 1,635.6m).
DIVIDEND PER SHARE
Defi nition Dividend per share
declared in respect of the year.
Performance The Board is
recommending a fi nal dividend of
11.9p per share, resulting in a total
dividend of 18.7p, 0.7p above last year.
In addition, a special dividend of 4.6p
will be paid at the same time as the
fi nal dividend.
FREE CASH FLOW (PRE SHAREHOLDER RETURNS)
(53 WEEKS)
Defi nition Free cash fl ow is the net cash
generated by the business in the period
before returns to shareholders.
Performance We delivered strong
free cash fl ow up 2.9% on last year
due to the increase in EBITDA and
reduced capital expenditure.
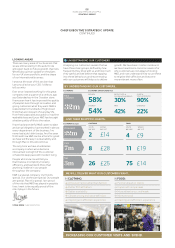
GROUP FINANCIAL OBJECTIVES
OBJECTIVE KPI 2015/16 PERFORMANCE (52 weeks to 26 March 2016)
Grow Group
revenue
Strong
cash
generation
Increase
earnings
and returns
15/16
14/15
13/14
12/13
GROUP REVENUE £bn
£10.4bn+0.8%
10.4
10.3
10.3
10.0
15/16
14/15
13/14
12/13
RETURN ON CAPITAL EMPLOYED %
15.0%
15.0
14.7
14.8
15.8
15/16
14/15
13/14
12/13
UNDERLYING EARNINGS PER SHARE p
34.8p+5.1%
34.8
33.1
32.2
31.9
15/16
14/15
13/14
12/13
DIVIDEND PER SHARE p
18.7p
18.7
18.0
17.0
17.0
+0.7p
15/16
14/15
13/14
12/13
FREE CASH FLOW
(PRE SHAREHOLDER RETURNS) £m
£539.3m+2.9%
539.3
524.2
427.9
204.1
15/16
14/15
13/14
12/13
UNDERLYING GROUP
PROFIT BEFORE TAX £m
£684.1m+3.5%
684.1
661.2
622.9
648.1