Marks and Spencer 2016 Annual Report Download - page 15
Download and view the complete annual report
Please find page 15 of the 2016 Marks and Spencer annual report below. You can navigate through the pages in the report by either clicking on the pages listed below, or by using the keyword search tool below to find specific information within the annual report.-
 1
1 -
2
-
3
-
4
-
 5
5 -
 6
6 -
 7
7 -
 8
8 -
 9
9 -
 10
10 -
 11
11 -
 12
12 -
 13
13 -
 14
14 -
 15
15 -
 16
16 -
 17
17 -
 18
18 -
 19
19 -
 20
20 -
 21
21 -
 22
22 -
 23
23 -
 24
24 -
 25
25 -
26
-
27
-
28
-
29
-
30
-
31
-
32
-
33
-
34
-
35
-
36
-
37
-
38
-
39
-
40
-
41
-
42
-
43
-
44
-
45
-
46
-
47
-
48
-
49
-
50
-
51
-
52
-
53
-
54
-
55
-
56
-
57
-
58
-
59
-
60
-
61
-
62
-
63
-
64
-
65
-
66
-
67
-
68
-
69
-
70
-
71
-
72
-
73
-
74
-
75
-
76
-
77
-
78
-
79
-
80
-
81
-
82
-
83
-
84
-
85
-
86
-
87
-
88
-
89
-
90
-
91
-
92
-
93
-
94
-
95
-
96
-
97
-
98
-
99
-
100
-
101
-
102
-
103
-
104
-
105
-
106
-
107
-
108
-
109
-
110
-
111
-
112
-
113
-
114
-
115
-
116
-
117
-
118
-
119
-
120
-
121
-
122
-
123
-
124
-
125
-
126
-
127
-
128
-
129
-
130
-
131
-
132
 |
 |

OUR BUSINESS
13
ANNUAL REPORT AND FINANCIAL STATEMENTS 2016
OUR PERFORMANCEGOVERNANCEFINANCIAL STATEMENTS
Read more about our Strategic Update on p06-08 Read more about our Business model on p10-11
Read more about KPIs on p18-21 Read more about Risk on p27-29
RELATED RISK FACTORS OUTPUTS
Strategic value created
There are a number of risks related
to how we deliver strategic value:
1. Clothing & Home transformation
2. Changing consumer behaviours
3. Business transformation
4. Clothing & Home supply chain
and logistics network
6. Food competition
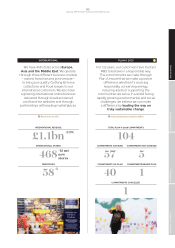
10. International
11. M&S.com business resilience
See Risk p28-29
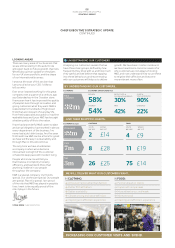
Strategic performance risks Key strategic measures
Food UK revenue
Food gross margin
Food LFL sales growth
UK space growth – Food
Clothing & Home UK revenue
Clothing & Home gross margin
Clothing & Home UK LFL
sales growth
International sales
International operating profi t
International space growth
M&S.com sales
M&S.com weekly site visits
See KPIs p20-21
Growth in sales, product
range and presence
Supply chain e ciency
Increased customer base
with broadening appeal
A more dynamic, fl exible
and agile business,
delivering stronger margins
Strong profi ts build
strong cash position
Returns to shareholders
Taxes to government
Increased investment
opportunities
Employee rewards
Group revenue
Underlying Group PBT
Underlying earnings per share
Dividend per share
Return on capital employed
Free cash fl ow (pre dividend)
See KPIs p18
Financial value created
Gro
There are a number of risks related
to how we deliver fi nancial value:
1. Clothing & Home transformation
2. Changing consumer behaviours
4. Clothing & Home supply chain
and logistics network
5. IT integration
10. International
See Risk p28-29
Financial performance risks Key fi nancial measures
Culture where innovation
and agility thrive
Better trained and fully
committed employees
Stronger relationships with
suppliers and communities
Maintained and improved
reputation with consumers
Total Food customers and average
number of shops per customer
Total Clothing & Home customers
and average number of shops
per customer
Employee engagement score
% of products with a
Plan A quality
Greenhouse gas emissions
(tonnes)
Greenhouse gas emissions (psf)
See KPIs p19
Non-fi nancial value created
There are a number of
risks related to how we deliver
non-fi nancial value:
1. Clothing & Home transformation
2. Changing consumer behaviours
3. Business transformation
7. Food safety and integrity
8. Clothing & Home
ethical sourcing
9. Cyber/Information security
See Risk p28-29
Non-fi nancial performance risks Key non-fi nancial measures
A
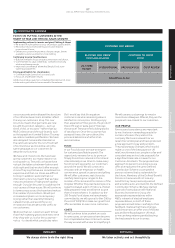
OUTCOMES
ACCOUNTABILITY
Strategic accountability
Financial accountability
See Governance on p42-46
See Remuneration p52-53
See Governance on p42-46
See Remuneration p52-53
Non-fi nancial accountability
BOARD
OPERATING COMMITTEE
SENIOR LEADERSHIP GROUP
OPERATIONAL
PLAN A COMMITTEE
ADVISORY
PLAN A COMMITTEE
>>>
See Plan A Report p24-25
BOARD
BOARD
OPERATING COMMITTEE
OPERATING COMMITTEE
SENIOR LEADERSHIP GROUP
SENIOR LEADERSHIP GROUP
>> >>