Marks and Spencer 2016 Annual Report Download - page 17
Download and view the complete annual report
Please find page 17 of the 2016 Marks and Spencer annual report below. You can navigate through the pages in the report by either clicking on the pages listed below, or by using the keyword search tool below to find specific information within the annual report.-
 1
1 -
2
-
3
-
4
-
5
-
6
-
 7
7 -
 8
8 -
 9
9 -
 10
10 -
 11
11 -
 12
12 -
 13
13 -
 14
14 -
 15
15 -
 16
16 -
 17
17 -
 18
18 -
 19
19 -
 20
20 -
 21
21 -
 22
22 -
 23
23 -
 24
24 -
 25
25 -
 26
26 -
 27
27 -
28
-
29
-
30
-
31
-
32
-
33
-
34
-
35
-
36
-
37
-
38
-
39
-
40
-
41
-
42
-
43
-
44
-
45
-
46
-
47
-
48
-
49
-
50
-
51
-
52
-
53
-
54
-
55
-
56
-
57
-
58
-
59
-
60
-
61
-
62
-
63
-
64
-
65
-
66
-
67
-
68
-
69
-
70
-
71
-
72
-
73
-
74
-
75
-
76
-
77
-
78
-
79
-
80
-
81
-
82
-
83
-
84
-
85
-
86
-
87
-
88
-
89
-
90
-
91
-
92
-
93
-
94
-
95
-
96
-
97
-
98
-
99
-
100
-
101
-
102
-
103
-
104
-
105
-
106
-
107
-
108
-
109
-
110
-
111
-
112
-
113
-
114
-
115
-
116
-
117
-
118
-
119
-
120
-
121
-
122
-
123
-
124
-
125
-
126
-
127
-
128
-
129
-
130
-
131
-
132
 |
 |

15
ANNUAL REPORT AND FINANCIAL STATEMENTS 2016
GOVERNANCEFINANCIAL STATEMENTS OUR BUSINESSOUR PERFORMANCE
OPERATING PERFORMANCE
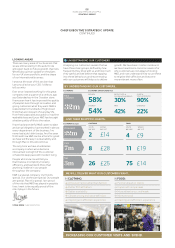
OUR PRODUCTS – FOOD
Special. New. Di erent. These are the
attributes that set our Food business apart,
and were the reasons behind another
strong performance this year. Sales rose
by 3.6%, to £5.4bn, and we once again grew
ahead of the market. Our aim of making
every food moment special was achieved
through the newness and quality of our
products. In a challenging and defl ationary
market, our market share rose to 4.3%.
Our strategic focus this year was
on o ering real choice and greater
convenience for our customers. We
concentrated on ensuring that each store
sold a range that was appropriate to its
location and size. The proportion of our
customers who bought food for today was
42%, almost four times higher than at our
larger rivals, so we rolled out new formats
with a strategic focus on convenience,
including a new layout for some of our
smaller Simply Food stores, which focuses
more on our Food On The Move o er. In
total, we opened 75 Simply Food stores in
the UK and seven overseas.
Prioritising availability is key to ensuring our
customers are able to buy what they want,
when they want. Getting the balance right
is a complex equation and this resulted in
slightly higher levels of waste during the
wet weather in the summer and in the
run up to Christmas, when we stocked
our stores in line with the trend of our
customers shopping increasingly closer to
Christmas itself. This put some pressure on
margins but this was o set by our ongoing
work to drive operational e ciencies.
We introduced 1,700 new products,
equivalent to 25% of our entire range.
Our unrivalled innovation means that
only 10% of our products are directly
comparable to our competitors’. This sets
us apart from the supermarkets. Customers
looking for the convenience of incredible
prepared food loved our new products,
whether we were introducing new cuisines
or reformulating old favourites. Under our
Taste umbrella, we launched new ranges
which included Greek, Lebanese and
Spanish prepared meals. We improved our
Indian range and redeveloped our pizzas.
Sales of our top-tier pizzas – now prepared
in wood-fi red stone ovens – rose 28% on
last year. We had a strong festive period,
with sales up 17% in the Christmas week
compared to the same week last year.
Our scores on quality over this period were
among the highest ever and we received
more awards than any other retailer in
Tried & Tested-style product press reviews.
Health is a primary concern for our
customers, and a big growth area for us.
The approach to healthy eating has moved
beyond short-term dieting and consumers
are now looking for ways to follow everyday
healthier lifestyles. So our product
development team has been working on
enabling our customers to make healthier
choices. All of our bread now has added
fi bre and vitamin D, and we removed
confectionary from till points, replacing
it with our new Healthy Snacking range,
in which all items are ‘Eat Well’ in regards
to fat, calories and salt.
R Maintaining our point of di erence in
a competitive market is central to the
ongoing success of our Food business.
Mitigating the impact of a changing
competitor landscape runs through every
element of our Food strategy, from our
focus on product innovation and newness
to a store expansion plan shaped around
o ering even more convenience for
our customers.
A In October, we announced a nationwide
unsold food redistribution scheme to
connect stores with local charities. The
scheme, now live in all our owned stores,
will help us achieve our Plan A target of
reducing like-for-like food waste by 20%
by 2020. Separately, 48% of our product
volume now comes from factories that
meet our Silver or Gold sustainability
benchmarking standard, while 73% of
our food items have a Plan A quality, for
example they are Fairtrade, organic or help
our customers choose a healthier lifestyle.
OUR PRODUCTS – CLOTHING & HOME
Our priorities in Clothing & Home were to
improve our gross margin and grow our
sales. Whilst we achieved the former, with
a 245bps increase, driven by improved
sourcing capabilities, we did not deliver on
the latter. Sales fell by 2.2%, which impacted
our market share in key categories. This
performance was unsatisfactory. The high
street clothing market had a di cult year,
with heavy promotional cycles and unusual
weather patterns. But our performance
highlighted a number of challenges with
our core clothing o er and these were
compounded by failures in execution.
To address this, we have set up a number of
cross-business unit workstreams to review
everything we do, from our products to our
prices to our processes. These projects are
ongoing, but we have already implemented
some changes. In order to further
improve our styling, we decided that it
was important to have one clear vision of
our female customers. So we consolidated
the Womenswear, Lingerie and Beauty
businesses under one Director and
appointed a Design Director for these
divisions, with the aim of o ering our
female customers greater consistency.
The new ranges will arrive in store later
this summer, and we are confi dent that
our customers will notice the di erence.
Our sourcing continues to improve, and
over 65% of all our products are now
created, designed and sourced in-house,
with a target of 70%. This has led to greater
collaboration between our design, buying
and regional sourcing teams; a key factor
in the gross margin improvement. At the
same time, our customers told us our value
perceptions were slipping so we have been
sharpening prices across our core ranges
to ensure we remain competitive with the
market – for example, we lowered prices on
over 300 products in our Spring Summer
2016 range. We are also working to improve
our availability and ensure we are buying
in the right mix of breadth and depth –
our average launch availability for Spring
Summer 2016 was 84% compared to 61%
for Spring Summer 2015.
We did enjoy a number of successes this
year. For example we achieved a record
market share of 33% in bras and 26.8% in
lingerie. We announced the launch of ‘M&S
&’; a series of unique collaborations with
some of today’s most exciting designers,
brands and fashion icons. The fi rst
collaboration – Archive by Alexa Chung –
saw 34,000 customers register their
interest. And, despite the dips in market
share, we remained the overall market
leader in clothing and footwear.
OUR PERFORMANCE