Marks and Spencer 2010 Annual Report Download - page 4
Download and view the complete annual report
Please find page 4 of the 2010 Marks and Spencer annual report below. You can navigate through the pages in the report by either clicking on the pages listed below, or by using the keyword search tool below to find specific information within the annual report.-
 1
1 -
 2
2 -
 3
3 -
 4
4 -
 5
5 -
 6
6 -
 7
7 -
 8
8 -
 9
9 -
 10
10 -
 11
11 -
 12
12 -
 13
13 -
 14
14 -
 15
15 -
16
-
17
-
18
-
19
-
20
-
21
-
22
-
23
-
24
-
25
-
26
-
27
-
28
-
29
-
30
-
31
-
32
-
33
-
34
-
35
-
36
-
37
-
38
-
39
-
40
-
41
-
42
-
43
-
44
-
45
-
46
-
47
-
48
-
49
-
50
-
51
-
52
-
53
-
54
-
55
-
56
-
57
-
58
-
59
-
60
-
61
-
62
-
63
-
64
-
65
-
66
-
67
-
68
-
69
-
70
-
71
-
72
-
73
-
74
-
75
-
76
-
77
-
78
-
79
-
80
-
81
-
82
-
83
-
84
-
85
-
86
-
87
-
88
-
89
-
90
-
91
-
92
-
93
-
94
-
95
-
96
-
97
-
98
-
99
-
100
-
101
-
102
-
103
-
104
-
105
-
106
-
107
-
108
-
109
-
110
-
111
-
112
-
113
-
114
-
115
-
116
-
117
-
118
-
119
-
120
-
121
-
122
-
123
-
124
-
125
-
126
 |
 |

s
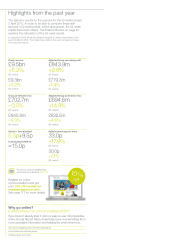
Highlights from the past year
Why go online?
marksandspencer.com/annualreport2010
If you haven’t already tried it, visit our easy-to-use, fully interactive
online Annual Report. Many shareholders are now benefiting from
more accessible information and helping the environment too.
It’s a more engaging and interactive experience
It’s printable as individual pages
It saves paper and costs
The statutory results for the year are for the 53 weeks ended
3 April 2010. In order to be able to compare these with
last year’s 52 week period, where appropriate, the 52 week
results have been stated. The Finance Review on page 42
explains the calculation of the 52 week results.
In September 2009 Kantar Worldpanel adjusted its market share data for the
period to March 2009. The market share data in this report is based on these
more accurate figures.
Group revenue
£9.5bn
+5.2%
(53 weeks)
£9.3bn
+3.2%
(52 weeks)
Group profit before tax
£702.7m
–0.5%
(53 weeks)
£640.6m
–9.3%
(52 weeks)
Adjusted Group profit before tax
£694.6m
+14.9%
(53 weeks)
£632.5m
+4.6%
(52 weeks)
Adjusted Group operating profit
£843.9m
+9.8%
(53 weeks)
£779.3m
+1.4%
(52 weeks)
Interim + final dividend
5.5p+9.5p
Total dividend 2009/10
=15.0p
Adjusted earnings per share
33.0p
+17. 9%
(53 weeks)
30.0p
+7.1%
(52 weeks)
For all our full and detailed key
performance indicators See p10
Register for online
communications and get
your 10% off voucher for
marksandspencer.com.
See page 117 for more details.
10%
off