Marks and Spencer 2010 Annual Report Download - page 12
Download and view the complete annual report
Please find page 12 of the 2010 Marks and Spencer annual report below. You can navigate through the pages in the report by either clicking on the pages listed below, or by using the keyword search tool below to find specific information within the annual report.-
 1
1 -
 2
2 -
 3
3 -
 4
4 -
 5
5 -
 6
6 -
 7
7 -
 8
8 -
 9
9 -
 10
10 -
 11
11 -
 12
12 -
 13
13 -
 14
14 -
 15
15 -
 16
16 -
 17
17 -
 18
18 -
 19
19 -
 20
20 -
 21
21 -
 22
22 -
23
-
24
-
25
-
26
-
27
-
28
-
29
-
30
-
31
-
32
-
33
-
34
-
35
-
36
-
37
-
38
-
39
-
40
-
41
-
42
-
43
-
44
-
45
-
46
-
47
-
48
-
49
-
50
-
51
-
52
-
53
-
54
-
55
-
56
-
57
-
58
-
59
-
60
-
61
-
62
-
63
-
64
-
65
-
66
-
67
-
68
-
69
-
70
-
71
-
72
-
73
-
74
-
75
-
76
-
77
-
78
-
79
-
80
-
81
-
82
-
83
-
84
-
85
-
86
-
87
-
88
-
89
-
90
-
91
-
92
-
93
-
94
-
95
-
96
-
97
-
98
-
99
-
100
-
101
-
102
-
103
-
104
-
105
-
106
-
107
-
108
-
109
-
110
-
111
-
112
-
113
-
114
-
115
-
116
-
117
-
118
-
119
-
120
-
121
-
122
-
123
-
124
-
125
-
126
 |
 |

Marks and Spencer Group plc Annual report and financial statements 2010 Directors’ report 08
Page Title
Page Title continued
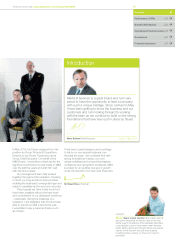
Performance overview
by Ian Dyson
Our performance*
This year our Group sales were up 3.2% to
£9.3bn. A combination of improving market
conditions and our own efforts helped us
achieve an increase in UK sales of 2.9%,
with a strong performance in all areas
of our business. Despite tough trading
conditions, particularly in Republic of Ireland
and Greece, our International business
delivered a strong performance, with sales
up 5.7%.
GM has seen market share growth in
both value and volume, with sales up 4.0%.
Continued investment in our margins has
helped Food return to positive like-for-like
sales of +0.3%.
M&S Direct has delivered another good
performance, with sales increasing to £413m
and remains on track to deliver £500m
by 2010/11.
Margins*
Our UK gross margin was 41.2%, down 5 bps.
This reflects our continued investment in
Food margins to provide our customers with
the value they want, without compromising
quality. Food gross margin was down 95
bps at 30.6%, with investment in prices and
promotions partly offset by better buying
and a reduction in food waste. GM margin
was up 70 bps at 52.5%, despite the weak
sterling performance this year. Over the last
12 months we have worked with our
suppliers to manage currency pressures in
our supply chain and delivered tighter stock
control and management of markdowns.
Cost management*
Total UK operating costs, excluding
bonuses, were £2,769m, an increase of
1.0%. Despite the pressure of increased
volumes, depreciation and inflation on
our cost base, through prudent cost
management we delivered savings of 5.3%
representing an underlying saving of £145m.
In addition, due to our significant
outperformance against our plan we have
paid a bonus of £81m to be shared by
employees across M&S.
Balance sheet management
Throughout 2009/10 we have remained
focused on improving our cash flows.
We reduced capital expenditure to £389m,
down from £652m in 2008/09 and have a
working capital inflow of £78m.
As a result we have generated a net
cash inflow of £412m after tax and dividend.
Focus on cash flow management has
enabled us to further reduce our net debt to
£2.1bn, from £2.5bn in 2008/09.
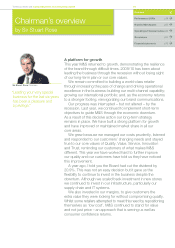
Last year we took decisive action to give us the strength and flexibility we needed
to navigate the recession. As a result we have emerged in a stronger position and
delivered an improved performance, with an adjusted 52 week profit before tax of
£632.5m up 4.6% from £604.4m in 2008/09. Whilst we have tackled the short-term
issues caused by the downturn we have remained focused on our long-term
strategy. Over the last 12 months, we have continued to invest in M&S, building
a platform for future growth through Project 2020.
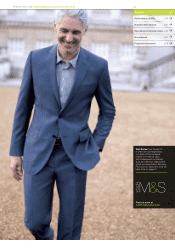
Ian Dyson Group Finance and Operations Director
INNOVATION
Right: Click to watch In December we launched
our iViewer TV – a British high street first. Viewers
can get BBC iPlayer straight to their screen with the
touch of a button. The TV also doubles as a digital
photoframe.
Since its opening in 2008, our furniture
supplier’s first UK eco factory – the 150,000
sq ft Westbridge Furniture factory in Holywell,
Wales – has reduced its CO2 emissions by
48%, energy use by 56% and water
consumption by 30%. The factory is also
on target to send no waste to landfill by 2012.
At the same time it produces some of the
most stylish pieces in the M&S range.
For more information about Plan A see
p36 or visit marksandspencer.com/plana
PLAN A: UK ECO FACTORY
Underlying cost savings
£145m
Group capital expenditure
£389m
Net debt
£ 2.1bn
* 52 weeks.