Marks and Spencer 2010 Annual Report Download - page 14
Download and view the complete annual report
Please find page 14 of the 2010 Marks and Spencer annual report below. You can navigate through the pages in the report by either clicking on the pages listed below, or by using the keyword search tool below to find specific information within the annual report.-
 1
1 -
2
-
3
-
 4
4 -
 5
5 -
 6
6 -
 7
7 -
 8
8 -
 9
9 -
 10
10 -
 11
11 -
 12
12 -
 13
13 -
 14
14 -
 15
15 -
 16
16 -
 17
17 -
 18
18 -
 19
19 -
 20
20 -
 21
21 -
 22
22 -
 23
23 -
 24
24 -
25
-
26
-
27
-
28
-
29
-
30
-
31
-
32
-
33
-
34
-
35
-
36
-
37
-
38
-
39
-
40
-
41
-
42
-
43
-
44
-
45
-
46
-
47
-
48
-
49
-
50
-
51
-
52
-
53
-
54
-
55
-
56
-
57
-
58
-
59
-
60
-
61
-
62
-
63
-
64
-
65
-
66
-
67
-
68
-
69
-
70
-
71
-
72
-
73
-
74
-
75
-
76
-
77
-
78
-
79
-
80
-
81
-
82
-
83
-
84
-
85
-
86
-
87
-
88
-
89
-
90
-
91
-
92
-
93
-
94
-
95
-
96
-
97
-
98
-
99
-
100
-
101
-
102
-
103
-
104
-
105
-
106
-
107
-
108
-
109
-
110
-
111
-
112
-
113
-
114
-
115
-
116
-
117
-
118
-
119
-
120
-
121
-
122
-
123
-
124
-
125
-
126
 |
 |

Marks and Spencer Group plc Annual report and financial statements 2010 Directors’ report 10
Page Title
Page Title continued
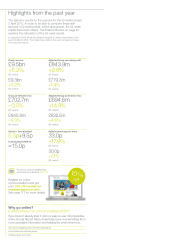
Performance overview
Key performance indicators
£9.5bn
+5.2%
Analysis: During the year
we grew our value market
share and held on volume,
see page 16 onwards for
details of our clothing
business.
Source: Kantar Worldpanel
Value market share
11. 0 %
2008/09 10.7%
2007/08 11.0%
2006/07 11.1%
UK market share Clothing and footwear
Volume market share
11. 2 %
2008/09 11.2%
2007/08 11.3%
2006/07 10.7%
UK market share Food
Analysis: Our market share is slightly
down, reflecting the fact we were the
only retailer to lower prices during what
was an inflationary period. See page
24 for details on how we are working
to further improve our Food business.
Source: Kantar Worldpanel
3.8%
2008/09 3.9%
2007/08 4.3%
2006/07 4.2%
What we sell
Growing our core UK business
Average weekly UK footfall
Analysis: Around half of UK stores
have cameras fitted at the entrance
to allow us to track customer visits.
We calculate our average footfall by
analysing the ratios between visits
and sales in these stores and then
applying it to stores without cameras.
£843.9m
+9.8%
UK mystery shopping programme
Analysis: Mystery shoppers anonymously visit
all of our UK stores once a month – twice for
flagship stores – to evaluate the levels of
service, scoring factors such as how staff
welcome customers and the management of
store environment. This year over 6,500 visits
were conducted and we have seen a 5%
increase in service scores.
Visits completed
6,500
average
score 89%
2008/09
2009/10
Apr
%
May Jun Jul Aug Sep Oct Nov Dec Jan Feb Mar
88 88 88
89
88 88 88 88
90
88
90 90
80 82
83
81
84
83 83
84
86
84
87 86
2007/08
21.8m
2006/07
21.0m
2008/09
21.6m
Financial performance These financial performance indicators are based on the statutory 53 week period ended 3 April 2010.
Performance against our strategy
Average weekly footfall
21.0m
Group revenue
Adjusted Group operating profit*
2009/10
21.0m
2009/10
2008/09
£8.588.1m
£9,536.6m
2006/07
2007/08 £9.022.0m
£9,062.1m
2009/10
2008/09
£1,044.0m
£843.9m
2006/07
2007/08 £1,089.3m
£768.9m
£m 06/07 07/08 08/09 09/10
UK 7,977. 5 8,309.1 8,164.3 8,5 67.9
International 610.6 712.9 8 9 7.8 968.7
Total 8,588.1 9,022.0 9,0 6 2.1 9,536.6
£m 06/07 07/08 08/09 09/10
UK 956.5 972.9 652.8 701.2
International 87.5 116.4 116.1 142.7
Total 1,044.0 1,089.3 768.9 843.9
p16