JetBlue Airlines 2015 Annual Report Download - page 41
Download and view the complete annual report
Please find page 41 of the 2015 JetBlue Airlines annual report below. You can navigate through the pages in the report by either clicking on the pages listed below, or by using the keyword search tool below to find specific information within the annual report.-
 1
1 -
2
-
3
-
4
-
5
-
6
-
7
-
8
-
9
-
10
-
11
-
12
-
13
-
14
-
15
-
16
-
17
-
18
-
19
-
20
-
21
-
22
-
23
-
24
-
25
-
26
-
27
-
28
-
29
-
30
-
 31
31 -
 32
32 -
 33
33 -
 34
34 -
 35
35 -
 36
36 -
 37
37 -
 38
38 -
 39
39 -
 40
40 -
 41
41 -
 42
42 -
 43
43 -
 44
44 -
 45
45 -
 46
46 -
 47
47 -
 48
48 -
 49
49 -
 50
50 -
 51
51 -
52
-
53
-
54
-
55
-
56
-
57
-
58
-
59
-
60
-
61
-
62
-
63
-
64
-
65
-
66
-
67
-
68
-
69
-
70
-
71
-
72
-
73
-
74
-
75
-
76
-
77
-
78
-
79
-
80
-
81
-
82
-
83
-
84
-
85
-
86
-
87
 |
 |

JETBLUE AIRWAYS CORPORATION-2015Annual Report 37
PART II
ITEM7Management’s Discussion and Analysis of Financial Condition and Results of Operations
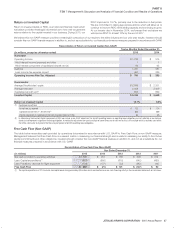
Return on Invested Capital
Return on invested capital, or ROIC, is an important financial metric which
we believe provides meaningful information as to how well we generate
returns relative to the capital invested in our business. During 2015, our
ROIC improved to 13.7%, primarily due to the reduction in fuel prices.
We are committed to taking appropriate actions which will allow us to
continue to improve ROIC while adding capacity and continuing to grow.
At our Investor day in November 2014, we forecast that we believe we
will improve ROIC to at least 10% by the end of 2017.
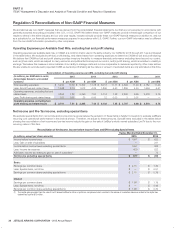
We believe this non-GAAP measure provides a meaningful comparison of our results to the airline industry and our prior year results. Investors should
consider this non-GAAP financial measure in addition to, and not as a substitute for, our financial performance measures prepared in accordance with GAAP.
Reconciliation of Return on Invested Capital (Non-GAAP)
(in millions, except as otherwise noted)
Twelve Months Ended December 31,
2015 2014
Numerator
Operating Income $ 1,216 $ 515
Add: Interest income (expense) and other 1 1
Add: Interest component of capitalized aircraft rent (a) 64 65
Subtotal 1,281 581
Less: Income tax expense impact 491 226
Operating Income After Tax, Adjusted $ 790 $ 355
Denominator
Average Stockholders’ equity $ 2,869 $ 2,331
Average total debt 2,038 2,409
Capitalized aircraft rent(1) 853 869
Invested Capital $ 5,760 $ 5,609
Return on Invested Capital 13.7% 6.3%
(1) Capitalized Aircraft Rent
Aircraft rent, as reported $ 122 $ 124
Capitalized aircraft rent (7 * Aircraft rent)(2) 853 869
Interest component of capitalized aircraft rent (Imputed interest at 7.5%) 64 65
(2) In determining the Invested Capital component of ROIC we include a non-GAAP adjustment for aircraft operating leases, as operating lease obligations are not reflected on our balance
sheets but do represent a significant financing obligation. In making the adjustment we used a multiple of seven times our aircraft rent as this is the multiple which is routinely used within
the airline community to represent the financing component of aircraft operating lease obligations.
Free Cash Flow (Non-GAAP)
The table below reconciles cash provided by operations determined in accordance with U.S. GAAP to Free Cash Flow, a non-GAAP measure.
Management believes that Free Cash Flow is a relevant metric in measuring our financial strength and is useful in assessing our ability to fund future
capital commitments and other obligations. Investors should consider this non-GAAP financial measure in addition to, and not as a substitute for, our
financial measures prepared in accordance with U.S. GAAP.
Reconciliation of Free Cash Flow (Non-GAAP)
(in millions)
Year Ended December 31,
2015 2014 2013 2012 2011
Net cash provided by operating activities $ 1,598 $ 912 $ 758 $ 698 $ 614
Less: Capital expenditures(1) (837) (806) (615) (542) (480)
Less: Predelivery deposits for flight equipment (104) (127) (22) (283) (44)
Free Cash Flow $ 657 $ (21) $ 121 $ (127) $ 90
(1) The capital expenditures in 2014 includes two capital leases for approximately $76 million which are classified as a non-cash financing activity in the consolidated statements of cash flows.