JetBlue Airlines 2015 Annual Report Download - page 40
Download and view the complete annual report
Please find page 40 of the 2015 JetBlue Airlines annual report below. You can navigate through the pages in the report by either clicking on the pages listed below, or by using the keyword search tool below to find specific information within the annual report.-
 1
1 -
2
-
3
-
4
-
5
-
6
-
7
-
8
-
9
-
10
-
11
-
12
-
13
-
14
-
15
-
16
-
17
-
18
-
19
-
20
-
21
-
22
-
23
-
24
-
25
-
26
-
27
-
28
-
29
-
 30
30 -
 31
31 -
 32
32 -
 33
33 -
 34
34 -
 35
35 -
 36
36 -
 37
37 -
 38
38 -
 39
39 -
 40
40 -
 41
41 -
 42
42 -
 43
43 -
 44
44 -
 45
45 -
 46
46 -
 47
47 -
 48
48 -
 49
49 -
 50
50 -
51
-
52
-
53
-
54
-
55
-
56
-
57
-
58
-
59
-
60
-
61
-
62
-
63
-
64
-
65
-
66
-
67
-
68
-
69
-
70
-
71
-
72
-
73
-
74
-
75
-
76
-
77
-
78
-
79
-
80
-
81
-
82
-
83
-
84
-
85
-
86
-
87
 |
 |

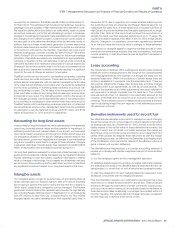
JETBLUE AIRWAYS CORPORATION-2015Annual Report36
PART II
ITEM7Management’s Discussion and Analysis of Financial Condition and Results of Operations
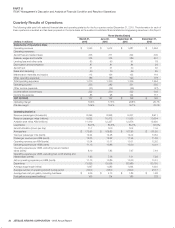
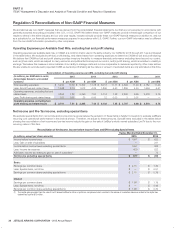
Regulation G Reconciliations of Non-GAAP Financial Measures
We sometimes use non-GAAP measures that are derived from the consolidated financial statements, but that are not presented in accordance with
generally accepted accounting principles in the U.S., or U.S. GAAP. We believe these non-GAAP measures provide a meaningful comparison of our
results to others in the airline industry and our prior year results. Investors should consider these non-GAAP financial measures in addition to, and not
as a substitute for, our financial performance measures prepared in accordance with U.S. GAAP. Further, our non-GAAP information may be different
from the non-GAAP information provided by other companies.
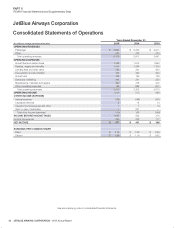
Operating Expenses per Available Seat Mile, excluding fuel and profit sharing
Operating expenses per available seat mile, or CASM, is a common metric used in the airline industry. Our CASM for 2015 through 2011 are summarized
in the table below. We exclude aircraft fuel, profit sharing, and related taxes from operating expenses to determine CASM ex-fuel and profit sharing.
We believe that CASM ex-fuel and profit sharing provides investors the ability to measure financial performance excluding items beyond our control,
such as (i) fuel costs, which are subject to many economic and political factors beyond our control, and (ii) profit sharing, which is sensitive to volatility in
earnings. We believe this measure is more indicative of our ability to manage costs and is more comparable to measures reported by other major airlines.
We are unable to reconcile such projected CASM ex-fuel and profit sharing as the nature or amount of excluded items are only estimated at this time.
Reconciliation of Operating expense per ASM, excluding fuel and profit sharing
(in millions; per ASM data in cents;
percentages based on unrounded
numbers)
2015 2014 2013 2012 2011
$ per ASM $ per ASM $ per ASM $ per ASM $ per ASM
Total operating expenses $ 5,200 10.56 $ 5,302 11.78 $ 5,013 11.71 $ 4,606 11.49 $ 4,182 11.23
Less: Aircraft fuel and related taxes 1,348 2.74 1,912 4.25 1,899 4.43 1,806 4.50 1,664 4.47
Operating expenses, excluding fuel and
related taxes 3,852 7.82 3,390 7.53 3,114 7.28 2,800 6.99 2,518 6.76
Less: Profit sharing and related taxes 151 0.31 25 0.05 12 0.03 3 0.01 — —
Operating expense, excluding fuel,
profit sharing and related taxes $ 3,701 7.51 $ 3,365 7.48 $ 3,102 7.25 $ 2,797 6.98 $ 2,518 6.76
Net Income and Pre-Tax Income, excluding special items
We exclude special items from net income and pre-tax income as we believe the exclusion of these items is helpful to investors to evaluate JetBlue’s
recurring core operational performance in the periods shown. Therefore, we adjust for these amounts. Special items excluded in the tables below
showing the reconciliation of net income and pre-tax income include the gain on the sale of JetBlue’s wholly-owned subsidiary LiveTV due to the non-
recurring nature of this item.
Reconciliation of Net Income, Income before Income Taxes and EPS excluding Special Items
(in millions, except per share amounts)
Twelve Months Ended December 31,
2015 2014
Income before income taxes $ 1,097 $ 623
Less: Gain on sale of subsidiary — 241
Income before income taxes excluding special items 1,097 382
Less: Income tax expense 420 222
Add back: Income tax relating to gain on sale of subsidiary(1) — 72
Net Income excluding special items $ 677 $ 232
Basic:
Earnings per common share $ 2.15 $ 1.36
Less: Special items, net of tax $ — $ 0.57
Earnings per common share excluding special items $ 2.15 $ 0.79
Diluted:
Earnings per common share $ 1.98 $ 1.19
Less: Special items, net of tax $ — $ 0.49
Earnings per common share excluding special items $ 1.98 $ 0.70
(1) The capital gain generated from the sale of LiveTV allowed JetBlue to utilize a capital loss carryforward which resulted in the release of a valuation allowance related to the capital loss
deferred tax asset of $19 million.