JetBlue Airlines 2015 Annual Report Download - page 32
Download and view the complete annual report
Please find page 32 of the 2015 JetBlue Airlines annual report below. You can navigate through the pages in the report by either clicking on the pages listed below, or by using the keyword search tool below to find specific information within the annual report.-
 1
1 -
2
-
3
-
4
-
5
-
6
-
7
-
8
-
9
-
10
-
11
-
12
-
13
-
14
-
15
-
16
-
17
-
18
-
19
-
20
-
21
-
 22
22 -
 23
23 -
 24
24 -
 25
25 -
 26
26 -
 27
27 -
 28
28 -
 29
29 -
 30
30 -
 31
31 -
 32
32 -
 33
33 -
 34
34 -
 35
35 -
 36
36 -
 37
37 -
 38
38 -
 39
39 -
 40
40 -
 41
41 -
 42
42 -
43
-
44
-
45
-
46
-
47
-
48
-
49
-
50
-
51
-
52
-
53
-
54
-
55
-
56
-
57
-
58
-
59
-
60
-
61
-
62
-
63
-
64
-
65
-
66
-
67
-
68
-
69
-
70
-
71
-
72
-
73
-
74
-
75
-
76
-
77
-
78
-
79
-
80
-
81
-
82
-
83
-
84
-
85
-
86
-
87
 |
 |

JETBLUE AIRWAYS CORPORATION-2015Annual Report28
PART II
ITEM7Management’s Discussion and Analysis of Financial Condition and Results of Operations
partially offset by the non-recurrence of operating costs associated with
LiveTV during the first six months of 2014, a $9 million gain in 2015 related
to an insurance recovery for a damaged engine, a legal settlement of $6
million and a $6 million gain on sale of an engine. Non-recurring items in
2014 included the sale of an engine for a gain of $3 million and a gain of
$4 million relating to a legal settlement.
Income Taxes
Our effective tax rate was 38% in 2015 and 36% in 2014. Our 2014
effective tax rate differs from the statutory income tax rate primarily due
to the release of the $19 million tax benefit related to the utilization of a
capital loss carryforward. We were able to utilize capital loss carryforwards
due to the sale of our subsidiary, LiveTV. The rate is also affected by state
income taxes and the non-deductibility of certain items for tax purposes.
The relative size of these items compared to our pre-tax income also
affect the rate.
Year 2014 compared to Year 2013
Overview
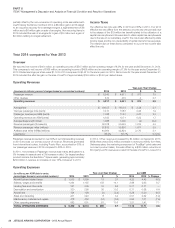
We reported net income of $401 million, an operating income of $515 million and an operating margin of 8.9% for the year ended December 31, 2014.
This compares to net income of $168 million, an operating income of $428 million and an operating margin of 7.9% for the year ended December 31,
2013. Diluted earnings per share were $1.19 for 2014 compared to $0.52 for the same period in 2013. Net income for the year ended December 31,
2014 included the after tax gain on the sale of LiveTV of approximately $169 million or $0.49 per diluted share.
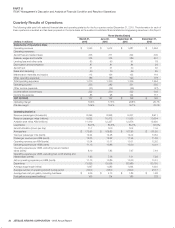
Operating Revenues
(revenues in millions; percent changes based on unroundednumbers)
Year-over-Year Change
2014 2013 $ %
Passenger revenue $ 5,343 $ 4,971 $ 372 7.5
Other revenue 474 470 4 0.7
Operating revenues $ 5,817 $ 5,441 $ 376 6.9
Average fare $ 166.57 $ 163.19 $ 3.38 2.1
Yield per passenger mile (cents) 14.13 13.87 0.26 1.9
Passenger revenue per ASM (cents) 11.88 11.61 0.27 2.3
Operating revenue per ASM (cents) 12.93 12.71 0.22 1.7
Average stage length (miles) 1,088 1,090 (2) (0.2)
Revenue passengers (thousands) 32,078 30,463 1,615 5.3
Revenue passenger miles (millions) 37,813 35,836 1,977 5.5
Available seat miles (ASMs) (millions) 44,994 42,824 2,170 5.1
Load factor 84.0% 83.7% 0.3 pts
Passenger revenue accounted for over 92% of our total operating revenues
in 2014 and was our primary source of revenue. Revenues generated
from international routes, including Puerto Rico, accounted for 30% of
our passenger revenue in 2014 compared to 28% in 2013.
In 2014 , the increase in Passenger revenue was mainly attributable to a
5% increase in capacity and a 2% increase in yield. Our largest ancillary
product remains the EvenMore™ Space seats, generating approximately
$200 million in revenue, an increase of over 16% compared to 2013.
In 2014, Other revenueincreased by$4 millioncompared to 2013.
While there was a $42 million increase in revenues mainly from fees,
Getawayssales, the marketing component of TrueBlue® point sales and
on-board product sales, this was offset by a $38 million reduction in
third party LiveTV revenue as a result of the sale of LiveTV in June 2014.
Operating Expenses
(in millions; per ASM data in cents;
percentages based on unrounded numbers)
Year-over-Year Change per ASM
2014 2013 $ % 2014 2013 % Change
Aircraft fuel and related taxes $ 1,912 $ 1,899 13 0.7 4.25 4.43 (4.1)
Salaries, wages and benefits 1,294 1,135 159 14.1 2.88 2.65 8.7
Landing fees and other rents 321 305 16 5.3 0.71 0.71 —
Depreciation and amortization 320 290 30 10.2 0.71 0.68 4.4
Aircraft rent 124 128 (4) (3.4) 0.28 0.30 (6.7)
Sales and marketing 231 223 8 3.4 0.51 0.52 (1.9)
Maintenance, materials and repairs 418 432 (14) (3.4) 0.93 1.01 (7.9)
Other operating expenses 682 601 81 13.5 1.51 1.41 7.1
TOTAL OPERATING EXPENSES $ 5,302 $ 5,013 $ 289 5.7 11.78 11.71 0.6