JetBlue Airlines 2015 Annual Report Download - page 31
Download and view the complete annual report
Please find page 31 of the 2015 JetBlue Airlines annual report below. You can navigate through the pages in the report by either clicking on the pages listed below, or by using the keyword search tool below to find specific information within the annual report.-
 1
1 -
2
-
3
-
4
-
5
-
6
-
7
-
8
-
9
-
10
-
11
-
12
-
13
-
14
-
15
-
16
-
17
-
18
-
19
-
20
-
 21
21 -
 22
22 -
 23
23 -
 24
24 -
 25
25 -
 26
26 -
 27
27 -
 28
28 -
 29
29 -
 30
30 -
 31
31 -
 32
32 -
 33
33 -
 34
34 -
 35
35 -
 36
36 -
 37
37 -
 38
38 -
 39
39 -
 40
40 -
 41
41 -
42
-
43
-
44
-
45
-
46
-
47
-
48
-
49
-
50
-
51
-
52
-
53
-
54
-
55
-
56
-
57
-
58
-
59
-
60
-
61
-
62
-
63
-
64
-
65
-
66
-
67
-
68
-
69
-
70
-
71
-
72
-
73
-
74
-
75
-
76
-
77
-
78
-
79
-
80
-
81
-
82
-
83
-
84
-
85
-
86
-
87
 |
 |

JETBLUE AIRWAYS CORPORATION-2015Annual Report 27
PART II
ITEM7Management’s Discussion and Analysis of Financial Condition and Results of Operations
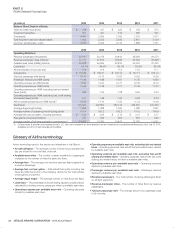
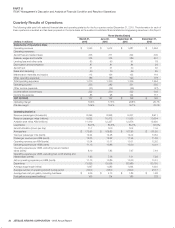
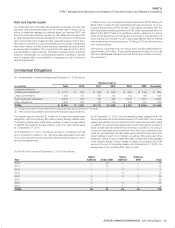
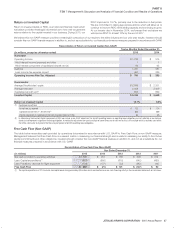
Operating Expenses
(in millions; per ASM data in cents;
percentages based on unrounded numbers)
Year-over-Year Change per ASM
2015 2014 $ % 2015 2014 % Change
Aircraft fuel and related taxes $ 1,348 $ 1,912 $ (564) (29.5) 2.74 4.25 (35.6)
Salaries, wages and benefits 1,540 1,294 246 19.1 3.13 2.88 8.8
Landing fees and other rents 342 321 21 6.7 0.70 0.71 (2.5)
Depreciation and amortization 345 320 25 7.7 0.70 0.71 (1.6)
Aircraft rent 122 124 (2) (1.8) 0.25 0.28 (10.3)
Sales and marketing 264 231 33 14.3 0.54 0.51 4.4
Maintenance, materials and repairs 490 418 72 17.3 0.99 0.93 7.1
Other operating expenses 749 682 67 9.8 1.51 1.51 —
TOTAL OPERATING EXPENSES $ 5,200 $ 5,302 $ (102) (1.9) 10.56 11.78 (10.4)
Aircraft Fuel and Related Taxes
Aircraft fuel and related taxes represents 26% of our total operating
expenses in 2015 compared to 36% in 2014. The average fuel price
decreased 35.6% in 2015 to $1.93 per gallon. This was partially offset by
an increase in our fuel consumption of approximately 61 million gallons.
Additional fuel consumption was mainly due to our increase in capacity
and lower flight cancellations during the first quarter of 2015 compared to
flight cancellations during the first quarter of 2014 as a result of the harsh
winter weather. Based on our expected fuel volume for 2016, a 10%per
gallon increase in the cost of aircraft fuel would increase our annual fuel
expense by approximately $120 million.
In 2015, we recorded fuel hedge losses of $126 million compared to $30
million in fuel hedge losses in 2014 which was recorded in Aircraft fuel
and related taxes. Fuel derivatives not qualifying as cash flow hedges
resulted in a gain of $2 million in 2014 which were recorded in Interest
income and other. Accounting ineffectiveness on fuel derivatives classified
as cash flow hedges resulted in losses of less than $1 million in both
2015 and 2014 and were recorded in Interest income and other. We
are unable to predict what the amount of ineffectiveness will be related
to these instruments, or the potential loss of hedge accounting which is
determined on a derivative-by-derivative basis, due to the volatility in the
forward markets for these commodities.
Salaries, Wages and Benefits
Salaries, wages and benefits represent approximately 30% of our total
operating expenses in 2015 compared to 24% in 2014. The increase in
salaries, wages and benefits was primarily driven by profit sharing and
an increase in our headcount. Our profit sharing is calculated as 15%
of adjusted pre-tax income, reduced by Retirement Plus contributions
and special items. Profit sharing increased by $126 million in 2015
compared to 2014, primarily driven by increased revenues and lower
aircraft fuel and related taxes. During 2015, the average number of full-
time equivalent employees increased by 9% and the average tenure of
our Crewmembers increased to 6.3 years. Retirement Plus contributions,
which equate to 5% of all of our eligible Crewmembers wages, increased
by $5 million and our 3% retirement contribution for a certain portion
of our FAA-licensed Crewmembers, which we refer to as Retirement
Advantage, increased by approximately $1 million. The increasing tenure
of our Crewmembers, rising healthcare costs and efforts to maintain
competitiveness in our overall compensation packages will continue to
pressure our costs in 2016.
We agreed to provide our pilots with a 20% pay increase in their base rate
over three years starting in 2014. In January 2014, the FAA’s rule amending
the FAA’s flight, duty, and rest regulations became effective. Among other
things, the new rule requires a ten hour minimum rest period prior to a
pilot’s flight duty period; mandates a pilot must have an opportunity for
eight hours of uninterrupted sleep within the rest period; and imposes new
pilot “flight time” and “duty time” limitations based upon report times, the
number of scheduled flight segments, and other operational factors. We
have hired additional pilots to address the requirements of the new rule.
Landing Fees and Other Rents
Landing fees and other rents include landing fees, which are at a premium
in the heavily trafficked northeast corridor of the U.S. where approximately
80% of our operations center. Other rents primarily consist of rent for
airports in our 93 BlueCities.
Landing fees and other rents increased $21 million, or 6.7%, in 2015
primarily due to increased departures.
Depreciation and Amortization
Depreciation and amortization primarily include depreciation for our owned
and capital leased aircraft, engines, and in-flight entertainment systems.
Depreciation and amortization increased $25 million, or 7.7%, primarily due
to an average of 149 owned and capital leased aircraft in 2015 compared
to 137 in 2014. Additionally, depreciation expense increased in 2015 due
to the completion of our international arrivals facility, T5i, and additional
gates at T5, which was completed in November 2014.
Sales and Marketing
In 2015, Sales and marketing increased $33 million, or 14.3%, primarily due
to increased sales distribution costs associated with increased revenues.
Maintenance, Materials and Repairs
Maintenance, materials and repairs are generally expensed when incurred
unless covered by a long-term flight hour services contract. The average
age of our aircraft in 2015 was 8.3 years which is relatively young compared
to our competitors. However, as our fleet ages our maintenance costs will
increase significantly, both on an absolute basis and as a percentage of
our unit costs, as older aircraft require additional, more expensive repairs
over time. We had an average of 11.7 additional total operating aircraft
in 2015 compared to 2014.
In 2015, Maintenance, materials and repairs increased by $72 million, or
17.3% compared to 2014, primarily driven by increased flight hours on
our engine flight-hour based maintenance repair agreements and by the
number of airframe heavy maintenance repairs.
Other Operating Expenses
Other operating expenses consist of the following categories: outside
services (including expenses related to fueling, ground handling, skycap,
security and janitorial services), insurance, personnel expenses, cost of
goods sold to other airlines by LiveTV when LiveTV was a subsidiary of
JetBlue, professional fees, on-board supplies, shop and office supplies, bad
debts, communication costs and taxes other than payroll and fuel taxes.
In 2015, Other operating expenses increased by $67 million, or 9.8%,
compared to 2014, primarily due to an increase in airport services and
passenger on-board supplies resulting from increased passengers flown,