JetBlue Airlines 2015 Annual Report Download - page 27
Download and view the complete annual report
Please find page 27 of the 2015 JetBlue Airlines annual report below. You can navigate through the pages in the report by either clicking on the pages listed below, or by using the keyword search tool below to find specific information within the annual report.-
 1
1 -
2
-
3
-
4
-
5
-
6
-
7
-
8
-
9
-
10
-
11
-
12
-
13
-
14
-
15
-
16
-
 17
17 -
 18
18 -
 19
19 -
 20
20 -
 21
21 -
 22
22 -
 23
23 -
 24
24 -
 25
25 -
 26
26 -
 27
27 -
 28
28 -
 29
29 -
 30
30 -
 31
31 -
 32
32 -
 33
33 -
 34
34 -
 35
35 -
 36
36 -
 37
37 -
38
-
39
-
40
-
41
-
42
-
43
-
44
-
45
-
46
-
47
-
48
-
49
-
50
-
51
-
52
-
53
-
54
-
55
-
56
-
57
-
58
-
59
-
60
-
61
-
62
-
63
-
64
-
65
-
66
-
67
-
68
-
69
-
70
-
71
-
72
-
73
-
74
-
75
-
76
-
77
-
78
-
79
-
80
-
81
-
82
-
83
-
84
-
85
-
86
-
87
 |
 |

JETBLUE AIRWAYS CORPORATION-2015Annual Report 23
PART II
ITEM6Selected Financial Data
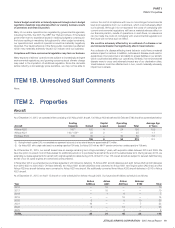
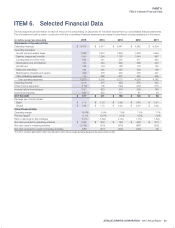
ITEM6. Selected Financial Data
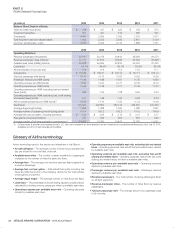
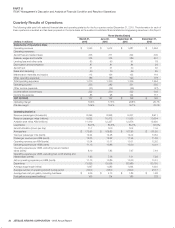
The following financial information for each of the prior five years ending on December 31 has been derived from our consolidated financial statements.
This information should be read in conjunction with the consolidated financial statements and related notes thereto included elsewhere in this report.
(in millions except per share data)
2015 2014 2013 2012 2011
Statements of Operations Data
Operating revenues $ 6,416 $ 5,817 $ 5,441 $ 4,982 $ 4,504
Operating expenses:
Aircraft fuel and related taxes 1,348 1,912 1,899 1,806 1,664
Salaries, wages and benefits 1,540 1,294 1,135 1,044 947
Landing fees and other rents 342 321 305 277 245
Depreciation and amortization 345 320 290 258 233
Aircraft rent 122 124 128 130 135
Sales and marketing 264 231 223 204 199
Maintenance materials and repairs 490 418 432 338 227
Other operating expenses 749 682 601 549 532
Total operating expenses 5,200 5,302 5,013 4,606 4,182
Operating income 1,216 515 428 376 322
Other income (expense)(1) (119) 108 (149) (167) (177)
Income before income taxes 1,097 623 279 209 145
Income tax expense 420 222 111 81 59
NET INCOME $ 677 $ 401 $ 168 $ 128 $ 86
Earnings per common share:
Basic $ 2.15 $ 1.36 $ 0.59 $ 0.45 $ 0.31
Diluted $ 1.98 $ 1.19 $ 0.52 $ 0.40 $ 0.28
Other Financial Data:
Operating margin 19.0% 8.9% 7.9% 7.5% 7.1%
Pre-tax margin(1) 17.1% 10.7% 5.1% 4.2% 3.2%
Ratio of earnings to fixed charges 5.71x 3.59x 2.05x 1.75x 1.52x
Net cash provided by operating activities $ 1,598 $ 912 $ 758 $ 698 $ 614
Net cash used in investing activities (1,134) (379) (476) (867) (502)
Net cash provided by (used in) financing activities (487) (417) (239) (322) 96
(1) In 2014, we had a gain of $241 million from the sale of LiveTV. Pre-tax margin excluding the gain on the sale of LiveTV is 6.6%.