Intel 2014 Annual Report Download - page 69
Download and view the complete annual report
Please find page 69 of the 2014 Intel annual report below. You can navigate through the pages in the report by either clicking on the pages listed below, or by using the keyword search tool below to find specific information within the annual report.-
 1
1 -
2
-
3
-
4
-
5
-
6
-
7
-
8
-
9
-
10
-
11
-
12
-
13
-
14
-
15
-
16
-
17
-
18
-
19
-
20
-
21
-
22
-
23
-
24
-
25
-
26
-
27
-
28
-
29
-
30
-
31
-
32
-
33
-
34
-
35
-
36
-
37
-
38
-
39
-
40
-
41
-
42
-
43
-
44
-
45
-
46
-
47
-
48
-
49
-
50
-
51
-
52
-
53
-
54
-
55
-
56
-
57
-
58
-
 59
59 -
 60
60 -
 61
61 -
 62
62 -
 63
63 -
 64
64 -
 65
65 -
 66
66 -
 67
67 -
 68
68 -
 69
69 -
 70
70 -
 71
71 -
 72
72 -
 73
73 -
 74
74 -
 75
75 -
 76
76 -
 77
77 -
 78
78 -
 79
79 -
80
-
81
-
82
-
83
-
84
-
85
-
86
-
87
-
88
-
89
-
90
-
91
-
92
-
93
-
94
-
95
-
96
-
97
-
98
-
99
-
100
-
101
-
102
-
103
-
104
-
105
-
106
-
107
-
108
-
109
-
110
-
111
-
112
-
113
-
114
-
115
-
116
-
117
-
118
-
119
-
120
-
121
-
122
-
123
-
124
-
125
-
126
-
127
-
128
-
129
 |
 |
INTEL CORPORATION
NOTES TO CONSOLIDATED FINANCIAL STATEMENTS (Continued)
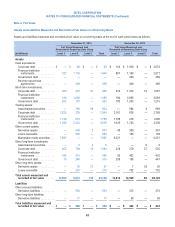
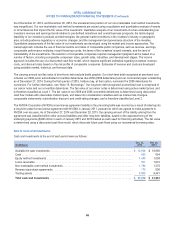
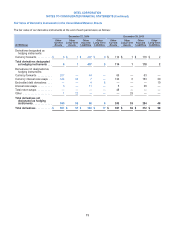
Government debt includes instruments such as non-U.S. government securities and U.S. agency securities. Financial institution
instruments include instruments issued or managed by financial institutions in various forms, such as commercial paper, fixed and
floating rate bonds, money market fund deposits, and time deposits.
For the year ended December 27, 2014 we transferred corporate debt, financial institution instruments, and government debt of
approximately $177 million from Level 1 to Level 2 of the fair value hierarchy, and approximately $395 million from Level 2 to Level 1.
These transfers were primarily based on changes in market activity for the underlying securities. Our policy is to reflect transfers
between the fair value hierarchy levels at the beginning of the quarter in which a change in circumstances resulted in the transfer.
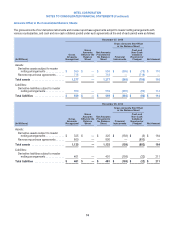
Investments in Debt Instruments
Debt instruments reflected in the preceding table include investments such as asset-backed securities, corporate debt, financial
institution instruments, government debt, and reverse repurchase agreements classified as cash equivalents. We classify our
debt instruments as Level 2 when we use observable market prices for identical securities that are traded in less active markets.
When observable market prices for identical securities are not available, we price the debt instruments using our own models,
such as a discounted cash flow model, or non-binding market consensus prices based on the proprietary valuation models of
pricing providers or brokers. We corroborate non-binding market consensus prices with observable market data using statistical
models when observable market data exists, quoted market prices for similar instruments, or pricing models such as a discounted
cash flow model. These valuation models incorporate a number of inputs, including non-binding and binding broker quotes;
observable market prices for identical or similar instruments; and the internal assumptions of pricing providers or brokers that use
observable market inputs and unobservable market inputs that we consider to be not significant. The discounted cash flow model
uses observable market inputs, such as LIBOR-based yield curves, currency spot and forward rates, and credit ratings. All
significant inputs are derived from or corroborated with observable market data.
The fair values of debt instruments classified as Level 3 are generally derived from discounted cash flow models, performed
either by us or our pricing providers, using inputs that we are unable to corroborate with observable market data. We monitor and
review the inputs and results of these valuation models to help ensure the fair value measurements are reasonable and
consistent with market experience in similar asset classes.
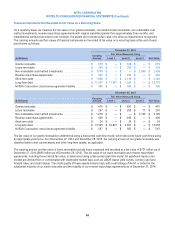
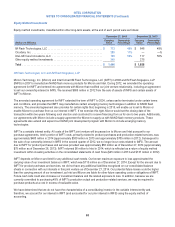
Fair Value Option for Loans Receivable
We elected the fair value option for loans receivable when the interest rate or currency exchange rate risk was hedged at
inception with a related derivative instrument. As of December 27, 2014 and December 28, 2013, the fair value of our loans
receivable for which we elected the fair value option did not significantly differ from the contractual principal balance based on the
contractual currency. Loans receivable are classified within other current assets and other long-term assets. Fair value is
determined using a discounted cash flow model, with all significant inputs derived from or corroborated with observable market
data. Gains and losses from changes in fair value on the loans receivable and related derivative instruments, as well as interest
income, are recorded in interest and other, net. During all periods presented, changes in the fair value of our loans receivable
were largely offset by changes in the related derivative instruments, resulting in an insignificant net impact on our consolidated
statements of income. Gains and losses attributable to changes in credit risk are determined using observable credit default
spreads for the issuer or comparable companies; these gains and losses were insignificant during all periods presented. We did
not elect the fair value option for loans receivable when the interest rate or currency exchange rate risk was not hedged at
inception with a related derivative instrument. Loans receivable not measured and recorded at fair value are included in the
following “Financial Instruments Not Recorded at Fair Value on a Recurring Basis” section.
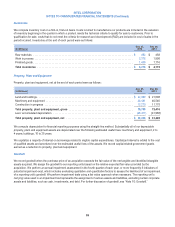
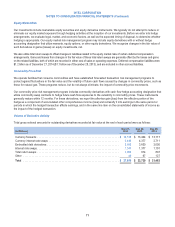
Assets Measured and Recorded at Fair Value on a Non-Recurring Basis
Our non-marketable equity investments, marketable equity method investments, and non-financial assets, such as intangible
assets and property, plant and equipment, are recorded at fair value only if an impairment is recognized.
Some of our non-marketable equity investments have been measured and recorded at fair value due to events or circumstances
that significantly impacted the fair value of those investments, resulting in other-than-temporary impairments. We classified these
investments as Level 3 because the valuations used unobservable inputs that were significant to the fair value measurements
and required management judgment due to the absence of quoted market prices. Impairments recognized on non-marketable
equity investments held as of December 27, 2014 were $128 million in 2014 ($106 million in 2013 on non-marketable equity
investments held as of December 28, 2013 and $68 million in 2012 on non-marketable equity investments held as of
December 29, 2012).
64