Intel 2014 Annual Report Download - page 103
Download and view the complete annual report
Please find page 103 of the 2014 Intel annual report below. You can navigate through the pages in the report by either clicking on the pages listed below, or by using the keyword search tool below to find specific information within the annual report.-
 1
1 -
2
-
3
-
4
-
5
-
6
-
7
-
8
-
9
-
10
-
11
-
12
-
13
-
14
-
15
-
16
-
17
-
18
-
19
-
20
-
21
-
22
-
23
-
24
-
25
-
26
-
27
-
28
-
29
-
30
-
31
-
32
-
33
-
34
-
35
-
36
-
37
-
38
-
39
-
40
-
41
-
42
-
43
-
44
-
45
-
46
-
47
-
48
-
49
-
50
-
51
-
52
-
53
-
54
-
55
-
56
-
57
-
58
-
59
-
60
-
61
-
62
-
63
-
64
-
65
-
66
-
67
-
68
-
69
-
70
-
71
-
72
-
73
-
74
-
75
-
76
-
77
-
78
-
79
-
80
-
81
-
82
-
83
-
84
-
85
-
86
-
87
-
88
-
89
-
90
-
91
-
92
-
 93
93 -
 94
94 -
 95
95 -
 96
96 -
 97
97 -
 98
98 -
 99
99 -
 100
100 -
 101
101 -
 102
102 -
 103
103 -
 104
104 -
 105
105 -
 106
106 -
 107
107 -
 108
108 -
 109
109 -
 110
110 -
 111
111 -
 112
112 -
 113
113 -
114
-
115
-
116
-
117
-
118
-
119
-
120
-
121
-
122
-
123
-
124
-
125
-
126
-
127
-
128
-
129
 |
 |

INTEL CORPORATION
NOTES TO CONSOLIDATED FINANCIAL STATEMENTS (Continued)
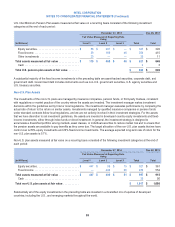
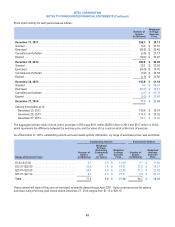
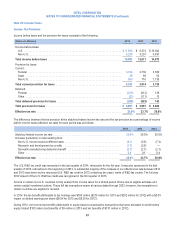
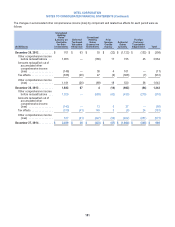
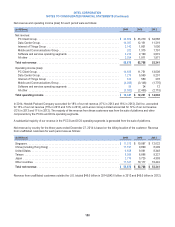
Deferred and Current Income Taxes
Deferred income taxes reflect the net tax effects of temporary differences between the carrying amounts of assets and liabilities
for financial reporting purposes and the amounts for income tax purposes. Significant components of our deferred tax assets and
liabilities at the end of each period were as follows:
(In Millions)
Dec 27,
2014
Dec 28,
2013
Deferred tax assets:
Accrued compensation and other benefits ................................................. $ 982 $ 1,047
Share-based compensation ............................................................ 438 564
Deferred income .................................................................... 691 672
Inventory .......................................................................... 339 733
State credits and net operating losses .................................................... 519 378
Other, net .......................................................................... 715 654
Gross deferred tax assets ............................................................ 3,684 4,048
Valuation allowance .................................................................. (595) (456)
Total deferred tax assets ............................................................. 3,089 3,592
Deferred tax liabilities:
Property, plant and equipment .......................................................... (1,171) (2,023)
Licenses and intangibles .............................................................. (576) (687)
Convertible debt ..................................................................... (977) (911)
Unrealized gains on investments and derivatives ........................................... (1,017) (815)
Investment in non-U.S. subsidiaries ..................................................... (252) (244)
Other, net .......................................................................... (291) (281)
Total deferred tax liabilities .......................................................... (4,284) (4,961)
Net deferred tax assets (liabilities) ..................................................... (1,195) (1,369)
Reported as:
Current deferred tax assets .......................................................... 1,958 2,594
Non-current deferred tax assets ...................................................... 622 434
Non-current deferred tax liabilities ..................................................... (3,775) (4,397)
Net deferred tax assets (liabilities) ..................................................... $ (1,195) $ (1,369)
Non-current deferred tax assets are included within other long-term assets on the consolidated balance sheets.
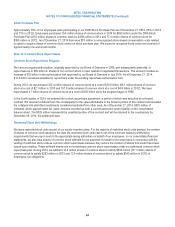
The valuation allowance is based on our assessment that it is more likely than not that certain deferred tax assets will not be
realized in the foreseeable future. The valuation allowance as of December 27, 2014 included allowances related to unrealized
state credit carryforwards of $507 million and matters related to our non-U.S. subsidiaries of $88 million.
As of December 27, 2014, our federal, state, and non-U.S. net operating loss carryforwards for income tax purposes were
$219 million, $375 million, and $393 million, respectively. Approximately one third of the non-U.S. net operating loss
carryforwards have no expiration date. The remaining non-U.S. as well as the U.S. federal and state net operating loss
carryforwards expire at various dates through 2034. A significant amount of the net operating loss carryforwards in the U.S.
relates to acquisitions and, as a result, is limited in the amount that can be recognized in any one year. The non-U.S. net
operating loss carryforwards include $291 million that is not likely to be recovered and has been reduced by a valuation
allowance.
98