Intel 2014 Annual Report Download - page 101
Download and view the complete annual report
Please find page 101 of the 2014 Intel annual report below. You can navigate through the pages in the report by either clicking on the pages listed below, or by using the keyword search tool below to find specific information within the annual report.-
 1
1 -
2
-
3
-
4
-
5
-
6
-
7
-
8
-
9
-
10
-
11
-
12
-
13
-
14
-
15
-
16
-
17
-
18
-
19
-
20
-
21
-
22
-
23
-
24
-
25
-
26
-
27
-
28
-
29
-
30
-
31
-
32
-
33
-
34
-
35
-
36
-
37
-
38
-
39
-
40
-
41
-
42
-
43
-
44
-
45
-
46
-
47
-
48
-
49
-
50
-
51
-
52
-
53
-
54
-
55
-
56
-
57
-
58
-
59
-
60
-
61
-
62
-
63
-
64
-
65
-
66
-
67
-
68
-
69
-
70
-
71
-
72
-
73
-
74
-
75
-
76
-
77
-
78
-
79
-
80
-
81
-
82
-
83
-
84
-
85
-
86
-
87
-
88
-
89
-
90
-
 91
91 -
 92
92 -
 93
93 -
 94
94 -
 95
95 -
 96
96 -
 97
97 -
 98
98 -
 99
99 -
 100
100 -
 101
101 -
 102
102 -
 103
103 -
 104
104 -
 105
105 -
 106
106 -
 107
107 -
 108
108 -
 109
109 -
 110
110 -
 111
111 -
112
-
113
-
114
-
115
-
116
-
117
-
118
-
119
-
120
-
121
-
122
-
123
-
124
-
125
-
126
-
127
-
128
-
129
 |
 |

INTEL CORPORATION
NOTES TO CONSOLIDATED FINANCIAL STATEMENTS (Continued)
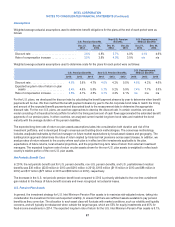
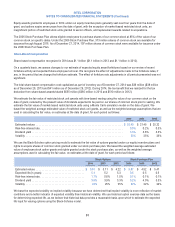
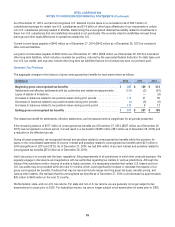
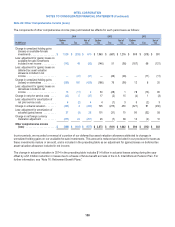
Note 22: Earnings Per Share
We computed our basic and diluted earnings per share of common stock for each period as follows:
(In Millions, Except Per Share Amounts) 2014 2013 2012
Net income available to common stockholders ................................ $ 11,704 $ 9,620 $ 11,005
Weighted average shares of common stock outstanding — basic ................ 4,901 4,970 4,996
Dilutive effect of employee equity incentive plans ................................. 75 68 100
Dilutive effect of convertible debt .............................................. 80 59 64
Weighted average shares of common stock outstanding — diluted ............... 5,056 5,097 5,160
Basic earnings per share of common stock ................................... $ 2.39 $ 1.94 $ 2.20
Diluted earnings per share of common stock .................................. $ 2.31 $ 1.89 $ 2.13
We computed basic earnings per share of common stock using net income available to common stockholders and the weighted
average number of shares of common stock outstanding during the period. We computed diluted earnings per share of common
stock using net income available to common stockholders and the weighted average number of shares of common stock
outstanding plus potentially dilutive shares of common stock outstanding during the period. Net income available to participating
securities was insignificant for all periods presented.
Potentially dilutive shares of common stock from employee incentive plans are determined by applying the treasury stock method
to the assumed exercise of outstanding stock options, the assumed vesting of outstanding restricted stock units, and the
assumed issuance of common stock under the stock purchase plan. Potentially dilutive shares of common stock for our 2005
debentures are determined by applying the if-converted method. However, as our 2009 debentures require settlement of the
principal amount of the debt in cash upon conversion, with the conversion premium paid in cash or stock at our option, potentially
dilutive shares of common stock are determined by applying the treasury stock method. For further discussion on the specific
conversion features of our 2005 and 2009 debentures, see “Note 15: Borrowings.”
In 2014, we excluded on average 10 million outstanding stock options and restricted stock units from the computation of diluted
earnings per share of common stock because these shares of common stock would have been anti-dilutive (55 million in 2013 and
29 million in 2012). These options could potentially be included in the diluted earnings per share of common stock calculation in the
future if the average market value of the shares of common stock increases and is greater than the exercise price of these options.
In all years presented, we included our 2009 debentures in the calculation of diluted earnings per share of common stock
because the average market price was above the conversion price. We could potentially exclude the 2009 debentures in the
future if the average market price is below the conversion price.
96