Intel 2010 Annual Report Download - page 59
Download and view the complete annual report
Please find page 59 of the 2010 Intel annual report below. You can navigate through the pages in the report by either clicking on the pages listed below, or by using the keyword search tool below to find specific information within the annual report.-
 1
1 -
2
-
3
-
4
-
5
-
6
-
7
-
8
-
9
-
10
-
11
-
12
-
13
-
14
-
15
-
16
-
17
-
18
-
19
-
20
-
21
-
22
-
23
-
24
-
25
-
26
-
27
-
28
-
29
-
30
-
31
-
32
-
33
-
34
-
35
-
36
-
37
-
38
-
39
-
40
-
41
-
42
-
43
-
44
-
45
-
46
-
47
-
48
-
 49
49 -
 50
50 -
 51
51 -
 52
52 -
 53
53 -
 54
54 -
 55
55 -
 56
56 -
 57
57 -
 58
58 -
 59
59 -
 60
60 -
 61
61 -
 62
62 -
 63
63 -
 64
64 -
 65
65 -
 66
66 -
 67
67 -
 68
68 -
 69
69 -
70
-
71
-
72
-
73
-
74
-
75
-
76
-
77
-
78
-
79
-
80
-
81
-
82
-
83
-
84
-
85
-
86
-
87
-
88
-
89
-
90
-
91
-
92
-
93
-
94
-
95
-
96
-
97
-
98
-
99
-
100
-
101
-
102
-
103
-
104
-
105
-
106
-
107
-
108
-
109
-
110
-
111
-
112
-
113
-
114
-
115
-
116
-
117
-
118
-
119
-
120
-
121
-
122
-
123
-
124
-
125
-
126
-
127
-
128
-
129
-
130
-
131
-
132
-
133
-
134
-
135
-
136
-
137
-
138
-
139
-
140
-
141
-
142
-
143
-
144
-
145
-
146
-
147
-
148
-
149
-
150
-
151
-
152
-
153
-
154
-
155
-
156
-
157
-
158
-
159
-
160
 |
 |

Table of Contents
MANAGEMENT’S DISCUSSION AND ANALYSIS OF FINANCIAL CONDITION AND RESULTS OF
OPERATIONS (Continued)
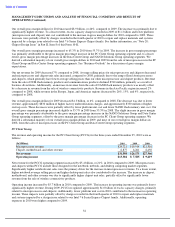
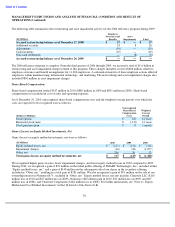
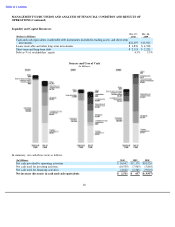
Liquidity and Capital Resources
Sources and Uses of Cash
(In Millions)
In summary, our cash flows were as follows:
40
Dec. 25,
Dec. 26,
(Dollars in Millions)
2010
2009
Cash and cash equivalents, marketable debt instruments included in trading assets, and short-
term
investments
$
21,497
$
13,920
Loans receivable and other long
-
term investments
$
3,876
$
4,528
Short
-
term and long
-
term debt
$
2,115
$
2,221
Debt as % of stockholders
’
equity
4.3
%
5.3
%
(In Millions)
2010
2009
2008
Net cash provided by operating activities
$
16,692
$
11,170
$
10,926
Net cash used for investing activities
(10,539
)
(7,965
)
(5,865
)
Net cash used for financing activities
(4,642
)
(2,568
)
(9,018
)
Net increase (decrease) in cash and cash equivalents
$
1,511
$
637
$
(3,957
)