Intel 2010 Annual Report Download - page 136
Download and view the complete annual report
Please find page 136 of the 2010 Intel annual report below. You can navigate through the pages in the report by either clicking on the pages listed below, or by using the keyword search tool below to find specific information within the annual report.-
 1
1 -
2
-
3
-
4
-
5
-
6
-
7
-
8
-
9
-
10
-
11
-
12
-
13
-
14
-
15
-
16
-
17
-
18
-
19
-
20
-
21
-
22
-
23
-
24
-
25
-
26
-
27
-
28
-
29
-
30
-
31
-
32
-
33
-
34
-
35
-
36
-
37
-
38
-
39
-
40
-
41
-
42
-
43
-
44
-
45
-
46
-
47
-
48
-
49
-
50
-
51
-
52
-
53
-
54
-
55
-
56
-
57
-
58
-
59
-
60
-
61
-
62
-
63
-
64
-
65
-
66
-
67
-
68
-
69
-
70
-
71
-
72
-
73
-
74
-
75
-
76
-
77
-
78
-
79
-
80
-
81
-
82
-
83
-
84
-
85
-
86
-
87
-
88
-
89
-
90
-
91
-
92
-
93
-
94
-
95
-
96
-
97
-
98
-
99
-
100
-
101
-
102
-
103
-
104
-
105
-
106
-
107
-
108
-
109
-
110
-
111
-
112
-
113
-
114
-
115
-
116
-
117
-
118
-
119
-
120
-
121
-
122
-
123
-
124
-
125
-
 126
126 -
 127
127 -
 128
128 -
 129
129 -
 130
130 -
 131
131 -
 132
132 -
 133
133 -
 134
134 -
 135
135 -
 136
136 -
 137
137 -
 138
138 -
 139
139 -
 140
140 -
 141
141 -
 142
142 -
 143
143 -
 144
144 -
 145
145 -
 146
146 -
147
-
148
-
149
-
150
-
151
-
152
-
153
-
154
-
155
-
156
-
157
-
158
-
159
-
160
 |
 |

Table of Contents
INTEL CORPORATION
NOTES TO CONSOLIDATED FINANCIAL STATEMENTS (Continued)
During 2009, we incurred charges of $1.447 billion as a result of the fine from the EC and $1.25 billion as a result of our legal
settlement with AMD. These charges were included in the “corporate” category. Additionally, the corporate category includes
expenses and charges such as:
The CODM does not evaluate operating segments using discrete asset information. Operating segments do not record inter-
segment revenue, and, accordingly, there is none to be reported. We do not allocate gains and losses from equity investments,
interest and other income, or taxes to operating segments. Although the CODM uses operating income to evaluate the
segments, operating costs included in one segment may benefit other segments. Except as discussed above, the accounting
policies for segment reporting are the same as for Intel as a whole.
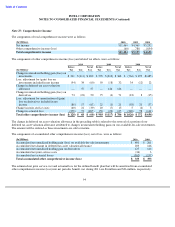
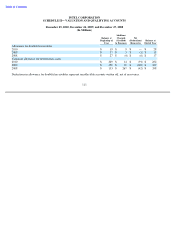
Net revenue and operating income (loss) for the three years ended December 25, 2010 were as follows:
In 2010, one customer accounted for 21% of our net revenue (21% in 2009 and 20% in 2008), while another customer
accounted for 17% of our net revenue (17% in 2009 and 18% in 2008). The majority of the revenue from these customers was
from the sale of microprocessors, chipsets, and other components by the PC Client Group and the Data Center Group
operating segments.
103
•
amounts included within restructuring and asset impairment charges;
•
a portion of profit
-
dependent compensation and other expenses not allocated to the operating segments;
•
results of operations of seed businesses that support our initiatives; and
•
acquisition
-
related costs, including amortization and any impairment of acquisition
-
related intangibles and goodwill.
(In Millions)
2010
2009
2008
Net revenue
PC Client Group
Microprocessor revenue
$
24,721
$
19,914
$
21,516
Chipset, motherboard, and other revenue
6,877
6,261
6,450
31,598
26,175
27,966
Data Center Group
Microprocessor revenue
7,361
5,301
5,126
Chipset, motherboard, and other revenue
1,332
1,149
1,464
8,693
6,450
6,590
Other Intel architecture operating segments
1,784
1,402
1,763
Other operating segments
1,501
970
579
Corporate
47
130
688
Total net revenue
$
43,623
$
35,127
$
37,586
Operating income (loss)
PC Client Group
$
13,304
$
7,585
$
9,419
Data Center Group
4,395
2,299
2,135
Other Intel architecture operating segments
(60
)
(179
)
(63
)
Other operating segments
(159
)
(284
)
(1,042
)
Corporate
(1,892
)
(3,710
)
(1,495
)
Total operating income
$
15,588
$
5,711
$
8,954