Intel 2010 Annual Report Download - page 37
Download and view the complete annual report
Please find page 37 of the 2010 Intel annual report below. You can navigate through the pages in the report by either clicking on the pages listed below, or by using the keyword search tool below to find specific information within the annual report.-
 1
1 -
2
-
3
-
4
-
5
-
6
-
7
-
8
-
9
-
10
-
11
-
12
-
13
-
14
-
15
-
16
-
17
-
18
-
19
-
20
-
21
-
22
-
23
-
24
-
25
-
26
-
 27
27 -
 28
28 -
 29
29 -
 30
30 -
 31
31 -
 32
32 -
 33
33 -
 34
34 -
 35
35 -
 36
36 -
 37
37 -
 38
38 -
 39
39 -
 40
40 -
 41
41 -
 42
42 -
 43
43 -
 44
44 -
 45
45 -
 46
46 -
 47
47 -
48
-
49
-
50
-
51
-
52
-
53
-
54
-
55
-
56
-
57
-
58
-
59
-
60
-
61
-
62
-
63
-
64
-
65
-
66
-
67
-
68
-
69
-
70
-
71
-
72
-
73
-
74
-
75
-
76
-
77
-
78
-
79
-
80
-
81
-
82
-
83
-
84
-
85
-
86
-
87
-
88
-
89
-
90
-
91
-
92
-
93
-
94
-
95
-
96
-
97
-
98
-
99
-
100
-
101
-
102
-
103
-
104
-
105
-
106
-
107
-
108
-
109
-
110
-
111
-
112
-
113
-
114
-
115
-
116
-
117
-
118
-
119
-
120
-
121
-
122
-
123
-
124
-
125
-
126
-
127
-
128
-
129
-
130
-
131
-
132
-
133
-
134
-
135
-
136
-
137
-
138
-
139
-
140
-
141
-
142
-
143
-
144
-
145
-
146
-
147
-
148
-
149
-
150
-
151
-
152
-
153
-
154
-
155
-
156
-
157
-
158
-
159
-
160
 |
 |

Table of Contents
Our Management’s Discussion and Analysis of Financial Condition and Results of Operations (MD&A) is provided in
addition to the accompanying consolidated financial statements and notes to assist readers in understanding our results of
operations, financial condition, and cash flows. MD&A is organized as follows:
The various sections of this MD&A contain a number of forward-looking statements. Words such as “expects,” “goals,”
“plans,” “believes,” “continues,” “may,” “will,” and variations of such words and similar expressions are intended to identify
such forward-looking statements. In addition, any statements that refer to projections of our future financial performance, our
anticipated growth and trends in our businesses, and other characterizations of future events or circumstances are forward-
looking statements. Such statements are based on our current expectations and could be affected by the uncertainties and risk
factors described throughout this filing and particularly in the “Business Outlook” section and in “Risk Factors” in Part I, Item
1A of this Form 10-K. Our actual results may differ materially, and other than our expected completion of the McAfee
acquisition in the first quarter of 2011 (see “Note 15: Acquisitions” in Part II, Item 8 of this Form 10-K), these forward-
looking statements do not reflect the potential impact of any divestitures, mergers, acquisitions, or other business combinations
that had not been completed as of February 18, 2011.
Overview
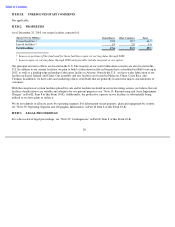
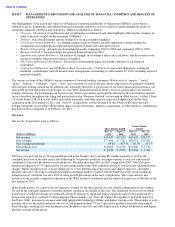
Our results of operations were as follows:
2010 was a record year for us. Strong market growth in the business and consumer PC market segments as well as the
continued build-out of the data center, the leadership of our product portfolio, and improvements to our cost structure all
contributed to the most profitable year in our history. Revenue increased 24% in 2010 compared to 2009. Our 2010 gross
margin percentage of 65.3% increased by 9.6 percentage points from 2009, primarily driven by lower factory underutilization
charges, higher microprocessor average selling prices, lower platform (microprocessor and chipset) unit cost, and higher
platform unit sales. We expect continued strength in emerging markets coupled with the build-out of the cloud computing
infrastructure to contribute toward a 2011 revenue growth percentage in the mid- to high-teens. This expectation is also
inclusive of the recently completed acquisition of the WLS business of Infineon and the expected acquisition of McAfee in the
first quarter of 2011.
In the fourth quarter, we achieved record quarterly revenue for the third quarter in a row despite continuation of the softness
we saw in the consumer segments of mature markets starting in the middle of the year. The sequential decrease in our fourth
quarter gross margin percentage was primarily driven by charges to repair and replace materials and systems impacted by a
design issue related to our Intel
®
6 Series Express Chipset family (see “Note 20: Chipset Design Issue” in Part II, Item 8 of
this Form 10-K), increased costs associated with taking older technology offline, and higher start-up
costs. These impacts were
partially offset by the qualification for sale of our 2nd generation Intel
®
Core
TM
processor products (formerly code-named
Sandy Bridge), resulting in lower microprocessor inventory write-offs and sales of previously written-off products, and higher
platform average selling prices.
ITEM 7.
MANAGEMENT’S DISCUSSION AND ANALYSIS OF FINANCIAL CONDITION AND RESULTS OF
OPERATIONS
• Overview. Discussion of our business and overall analysis of financial and other highlights affecting the company in
order to provide context for the remainder of MD&A.
•
Strategy.
Our overall strategy and the strategy for our major market segments.
• Critical Accounting Estimates. Accounting estimates that we believe are most important to understanding the
assumptions and judgments incorporated in our reported financial results and forecasts.
•
Results of Operations.
An analysis of our financial results comparing 2010 to 2009 and comparing 2009 to 2008.
•
Business Outlook.
Our expectations for selected financial items for 2011.
•
Liquidity and Capital Resources.
An analysis of changes in our balance sheets and cash flows, and discussion of our
financial condition and potential sources of liquidity.
•
Fair Value of Financial Instruments.
Discussion of the methodologies used in the valuation of our financial
instruments.
• Contractual Obligations and Off-Balance-Sheet Arrangements . Overview of contractual obligations, contingent
liabilities, commitments, and off-balance-
sheet arrangements outstanding as of December 25, 2010, including expected
payment schedule.
Three Months Ended
Twelve Months
Ended
Dec. 25,
Sept. 25,
Dec. 25,
Dec. 26,
(Dollars in Millions)
2010
2010
2010
2009
Net revenue
$
11,457
$
11,102
$
43,623
$
35,127
Gross margin
$
7,406
$
7,321
$
28,491
$
19,561
Gross margin percentage
64.6
%
65.9
%
65.3
%
55.7
%
Operating income
$
4,023
$
4,136
$
15,588
$
5,711
Net income
$
3,180
$
2,955
$
11,464
$
4,369