Intel 2010 Annual Report Download - page 118
Download and view the complete annual report
Please find page 118 of the 2010 Intel annual report below. You can navigate through the pages in the report by either clicking on the pages listed below, or by using the keyword search tool below to find specific information within the annual report.-
 1
1 -
2
-
3
-
4
-
5
-
6
-
7
-
8
-
9
-
10
-
11
-
12
-
13
-
14
-
15
-
16
-
17
-
18
-
19
-
20
-
21
-
22
-
23
-
24
-
25
-
26
-
27
-
28
-
29
-
30
-
31
-
32
-
33
-
34
-
35
-
36
-
37
-
38
-
39
-
40
-
41
-
42
-
43
-
44
-
45
-
46
-
47
-
48
-
49
-
50
-
51
-
52
-
53
-
54
-
55
-
56
-
57
-
58
-
59
-
60
-
61
-
62
-
63
-
64
-
65
-
66
-
67
-
68
-
69
-
70
-
71
-
72
-
73
-
74
-
75
-
76
-
77
-
78
-
79
-
80
-
81
-
82
-
83
-
84
-
85
-
86
-
87
-
88
-
89
-
90
-
91
-
92
-
93
-
94
-
95
-
96
-
97
-
98
-
99
-
100
-
101
-
102
-
103
-
104
-
105
-
106
-
107
-
 108
108 -
 109
109 -
 110
110 -
 111
111 -
 112
112 -
 113
113 -
 114
114 -
 115
115 -
 116
116 -
 117
117 -
 118
118 -
 119
119 -
 120
120 -
 121
121 -
 122
122 -
 123
123 -
 124
124 -
 125
125 -
 126
126 -
 127
127 -
 128
128 -
129
-
130
-
131
-
132
-
133
-
134
-
135
-
136
-
137
-
138
-
139
-
140
-
141
-
142
-
143
-
144
-
145
-
146
-
147
-
148
-
149
-
150
-
151
-
152
-
153
-
154
-
155
-
156
-
157
-
158
-
159
-
160
 |
 |

Table of Contents
INTEL CORPORATION
NOTES TO CONSOLIDATED FINANCIAL STATEMENTS (Continued)
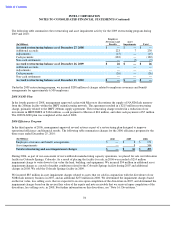
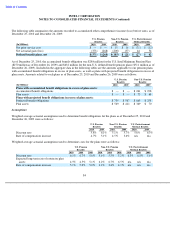
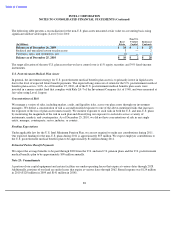
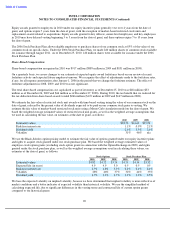
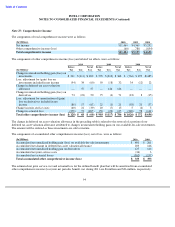
The following table presents a reconciliation for the non-U.S. plan assets measured at fair value on a recurring basis using
significant unobservable inputs (Level 3) for 2010:
The target allocation of the non-U.S. plan assets that we have control over is 61% equity securities and 39% fixed-income
instruments.
U.S. Postretirement Medical Plan Assets
In general, the investment strategy for U.S. postretirement medical benefits plan assets is to primarily invest in liquid assets
due to the level of expected future benefit payments. The expected long-
term rate of return for the U.S. postretirement medical
benefits plan assets is 3.0%. As of December 25, 2010, all of the U.S. postretirement medical benefits plan assets were
invested in a money market fund that complies with Rule 2A-7
of the Investment Company Act of 1940, and were measured at
fair value using Level 1 inputs.
Concentrations of Risk
We manage a variety of risks, including market, credit, and liquidity risks, across our plan assets through our investment
managers. We define a concentration of risk as an undiversified exposure to one of the above-mentioned risks that increases
the exposure of the loss of plan assets unnecessarily. We monitor exposure to such risks in both the U.S. and non-U.S. plans
by monitoring the magnitude of the risk in each plan and diversifying our exposure to such risks across a variety of
instruments, markets, and counterparties. As of December 25, 2010, we did not have concentrations of risk in any single
entity, manager, counterparty, sector, industry, or country.
Funding Expectations
Under applicable law for the U.S. Intel Minimum Pension Plan, we are not required to make any contributions during 2011.
Our expected funding for the non-U.S. plans during 2011 is approximately $55 million. We expect employer contributions to
the U.S. postretirement medical benefits plan to be approximately $1 million during 2011.
Estimated Future Benefit Payments
We expect the average benefits to be paid through 2020 from the U.S. and non-U.S. pension plans and the U.S. postretirement
medical benefits plan to be approximately $90 million annually.
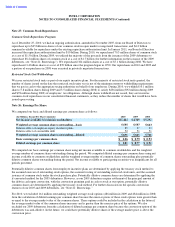
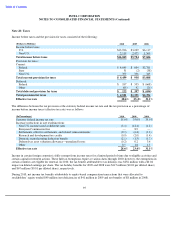
Note 23: Commitments
A portion of our capital equipment and certain facilities are under operating leases that expire at various dates through 2028.
Additionally, portions of our land are under leases that expire at various dates through 2062. Rental expense was $124 million
in 2010 ($120 million in 2009 and $141 million in 2008).
88
Non
-
U.S.
Real
Venture
Insurance
(In Millions)
Estate
Capital
Contracts
Balance as of December 26, 2009
$
14
$
2
$
25
Realized and unrealized return on plan assets
3
—
2
Purchases, sales, and settlements, net
(7
)
—
1
Balance as of December 25, 2010
$
10
$
2
$
28