Incredimail 2013 Annual Report Download - page 7
Download and view the complete annual report
Please find page 7 of the 2013 Incredimail annual report below. You can navigate through the pages in the report by either clicking on the pages listed below, or by using the keyword search tool below to find specific information within the annual report.-
 1
1 -
 2
2 -
 3
3 -
 4
4 -
 5
5 -
 6
6 -
 7
7 -
 8
8 -
 9
9 -
 10
10 -
 11
11 -
 12
12 -
 13
13 -
 14
14 -
 15
15 -
 16
16 -
 17
17 -
 18
18 -
19
-
20
-
21
-
22
-
23
-
24
-
25
-
26
-
27
-
28
-
29
-
30
-
31
-
32
-
33
-
34
-
35
-
36
-
37
-
38
-
39
-
40
-
41
-
42
-
43
-
44
-
45
-
46
-
47
-
48
-
49
-
50
-
51
-
52
-
53
-
54
-
55
-
56
-
57
-
58
-
59
-
60
-
61
-
62
-
63
-
64
-
65
-
66
-
67
-
68
-
69
-
70
-
71
-
72
-
73
-
74
-
75
-
76
-
77
-
78
-
79
-
80
-
81
-
82
-
83
-
84
-
85
-
86
-
87
-
88
-
89
-
90
-
91
-
92
-
93
-
94
-
95
-
96
-
97
-
98
-
99
-
100
-
101
-
102
-
103
-
104
-
105
-
106
-
107
-
108
-
109
-
110
-
111
-
112
-
113
-
114
-
115
-
116
-
117
-
118
-
119
-
120
-
121
-
122
-
123
-
124
-
125
-
126
-
127
-
128
-
129
-
130
-
131
-
132
-
133
-
134
-
135
-
136
-
137
-
138
-
139
-
140
-
141
-
142
-
143
-
144
-
145
-
146
-
147
-
148
-
149
-
150
-
151
-
152
-
153
-
154
-
155
-
156
-
157
-
158
-
159
-
160
-
161
-
162
-
163
-
164
-
165
-
166
-
167
-
168
-
169
-
170
-
171
-
172
-
173
-
174
-
175
-
176
-
177
-
178
-
179
-
180
-
181
-
182
-
183
-
184
-
185
-
186
-
187
-
188
-
189
-
190
-
191
-
192
-
193
-
194
-
195
-
196
-
197
-
198
-
199
-
200
-
201
-
202
-
203
-
204
-
205
-
206
-
207
-
208
-
209
-
210
-
211
-
212
-
213
-
214
-
215
-
216
-
217
-
218
-
219
-
220
-
221
-
222
-
223
-
224
-
225
-
226
-
227
-
228
-
229
-
230
-
231
-
232
-
233
-
234
-
235
-
236
-
237
-
238
-
239
-
240
-
241
-
242
-
243
-
244
-
245
-
246
-
247
-
248
-
249
-
250
-
251
-
252
-
253
-
254
-
255
-
256
-
257
-
258
-
259
 |
 |

PA RT I
ITEM 1. IDENTITY OF DIRECTORS, SENIOR MANAGEMENT AND ADVISERS
Not applicable.
ITEM 2. OFFER STATISTICS AND EXPECTED TIMETABLE
Not applicable.
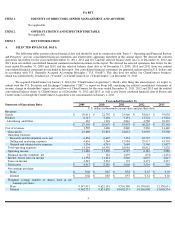
ITEM 3. KEY INFORMATION
A. SELECTED FINANCIAL DATA
The following tables present selected financial data and should be read in conjunction with "Item 5 –
Operating and Financial Review
and Prospects" and our consolidated financial statements and related notes appearing elsewhere in this annual report. We derived the selected
operations data below for the years ended December 31, 2011, 2012 and 2013 and the selected balance sheet data as of December 31, 2012 and
2013 from our audited consolidated financial statements included elsewhere in this report. We derived the selected operations data below for the
years ended December 31, 2009 and 2010 and the selected balance sheet data as of December 31, 2009, 2010 and 2011 from our audited
consolidated financial statements not included in this report. Our consolidated financial statements are prepared and presented in U.S. dollars and
in accordance with U.S. Generally Accepted Accounting Principles ("U.S. GAAP"). This data does not reflect our ClientConnect business,
which was transferred by Conduit Ltd. ("Conduit") to ClientConnect Ltd. ("ClientConnect") on December 31, 2013.
We acquired ClientConnect on January 2, 2014 (the "ClientConnect Acquisition"). Shortly after filing this annual report, we expect to
submit with the U.S. Securities and Exchange Commission ("SEC") a report on Form 6-
K containing the audited consolidated statements of
income, change in shareholders' equity and cash flows of ClientConnect for the years ended December 31, 2011, 2012 and 2013 and the audited
consolidated balance sheets of ClientConnect as of December 31, 2012 and 2013, as well as pro forma combined financial data of Perion and
ClientConnect as though the ClientConnect Acquisition were consummated on January 1, 2013.
Year ended December 31,
Statement of Operations Data:
2009
2010
2011
2012
2013
U.S. dollars in thousands (except share and per share data)
Revenues
Search
$
20,011
$
22,792
$
25,466
$
38,061
$
59,038
Products
6,717
5,404
7,191
17,574
17,818
Advertising and Other
467
1,301
2,816
4,588
10,292
$
27,195
$
29,497
$
35,473
$
60,223
$
87,148
Cost of revenues
1,505
1,606
2,840
5,230
11,440
Gross profit
25,690
27,891
32,633
54,993
75,708
Operating expenses:
Research and development costs, net
6,254
6,607
7,453
10,735
13,393
Selling and marketing expenses
4,616
5,244
12,984
29,517
43,358
General and administrative expenses
3,334
4,741
7,649
8,560
15,077
Total operating expenses
14,204
16,592
28,086
48,812
71,828
Operating income
11,486
11,299
4,547
6,181
3,880
Financial income (expense), net
72
322
1,293
(174
)
(1,233
)
Income, before taxes on income
11,558
11,621
5,840
6,007
2,647
Taxes on income
3,545
3,232
172
2,473
2,337
Net income
$
8,013
$
8,389
$
5,668
$
3,534
$
310
Net earnings per share:
Basic
$
0.86
$
0.87
$
0.58
$
0.35
$
0.03
Diluted
$
0.84
$
0.85
$
0.57
$
0.34
$
0.02
Weighted average number of shares used in net
earnings per share:
Basic
9,347,915
9,622,181
9,796,380
10,159,049
12,330,631
Diluted
9,562,721
9,831,628
10,002,171
10,366,808
13,003,334
3