Huntington National Bank 2012 Annual Report Download - page 4
Download and view the complete annual report
Please find page 4 of the 2012 Huntington National Bank annual report below. You can navigate through the pages in the report by either clicking on the pages listed below, or by using the keyword search tool below to find specific information within the annual report.-
 1
1 -
 2
2 -
 3
3 -
 4
4 -
 5
5 -
 6
6 -
 7
7 -
 8
8 -
 9
9 -
 10
10 -
 11
11 -
 12
12 -
 13
13 -
 14
14 -
 15
15 -
16
-
17
-
18
-
19
-
20
-
21
-
22
-
23
-
24
-
25
-
26
-
27
-
28
-
29
-
30
-
31
-
32
-
33
-
34
-
35
-
36
-
37
-
38
-
39
-
40
-
41
-
42
-
43
-
44
-
45
-
46
-
47
-
48
-
49
-
50
-
51
-
52
-
53
-
54
-
55
-
56
-
57
-
58
-
59
-
60
-
61
-
62
-
63
-
64
-
65
-
66
-
67
-
68
-
69
-
70
-
71
-
72
-
73
-
74
-
75
-
76
-
77
-
78
-
79
-
80
-
81
-
82
-
83
-
84
-
85
-
86
-
87
-
88
-
89
-
90
-
91
-
92
-
93
-
94
-
95
-
96
-
97
-
98
-
99
-
100
-
101
-
102
-
103
-
104
-
105
-
106
-
107
-
108
-
109
-
110
-
111
-
112
-
113
-
114
-
115
-
116
-
117
-
118
-
119
-
120
-
121
-
122
-
123
-
124
-
125
-
126
-
127
-
128
-
129
-
130
-
131
-
132
-
133
-
134
-
135
-
136
-
137
-
138
-
139
-
140
-
141
-
142
-
143
-
144
-
145
-
146
-
147
-
148
-
149
-
150
-
151
-
152
-
153
-
154
-
155
-
156
-
157
-
158
-
159
-
160
-
161
-
162
-
163
-
164
-
165
-
166
-
167
-
168
-
169
-
170
-
171
-
172
-
173
-
174
-
175
-
176
-
177
-
178
-
179
-
180
-
181
-
182
-
183
-
184
-
185
-
186
-
187
-
188
-
189
-
190
-
191
-
192
-
193
-
194
-
195
-
196
-
197
-
198
-
199
-
200
-
201
-
202
-
203
-
204
-
205
-
206
-
207
-
208
-
209
-
210
-
211
-
212
 |
 |

customers with new residential mortgages and consumer loans. Automobile Finance, where we have an over 50-
year legacy and distinct expertise, originated a record $4 billion of automobile loans and made great progress
with our expansion into the New England and northern Midwest markets. Small businesses are a critical priority
for us. We were once again the No. 1 Small Business Administration lender across our six-state footprint and
ranked “Highest in Customer Satisfaction with Small Business Banking” according to J.D. Power and Associates.
Our “Fair Play” banking philosophy implemented in 2010 aligns with the spirit of many of the new
consumer banking regulations. Other banks continue to add fees and reduce convenience, while we believe the
path to long-term relationships with our customers is through a superior level of service built around simple
products that are easy to understand. As shown by being named one of the Best Banks in America 2012 by
MONEY Magazine and the nearly 10% increase in the percentage of both consumer and commercial customers
with 4+ products and services over the past two years, customers agree. Looking forward, we believe these deep
relationships will assist us over the next several years, as we navigate a considerable amount of new regulation
that has yet to be finalized and implemented. Whether it is the final Basel III capital and liquidity standards, new
rules set forth by the Consumer Financial Protection Bureau, or moving from the Federal Reserve Board Capital
Plan Review (CapPR) to its Comprehensive Capital Analysis and Review (CCAR), we will continue to adapt and
drive our financial performance consistent with our long-term strategies.
2012 Performance Recap
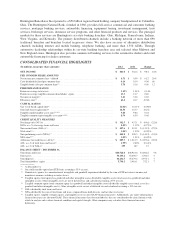
Net income increased 18% to the record level of $641.0 million and earnings per common share increased to
$0.71, or 20% growth from the prior year and above our long-term goal of 6%-8%. Profitability, as measured by
our return on average assets (ROA) and return on average tangible common equity, increased to 1.15% and
13.5%, respectively. Since we established our long-term goals in 2010, 2012 was the first year that the ROA was
within our targeted range of 1.10%-1.35%.
Fully-taxable equivalent total revenue increased $204.1 million, or 8%, from 2011 as noninterest income
increased $117.2 million, or 12%, and net interest income increased $86.8 million, or 5%, from the prior year.
The increase in noninterest income was driven by a $107.7 million, or 129%, increase in mortgage banking
income, a $26.2 million, or 82%, increase in gain on sale of loans, an $18.7 million, or 8%, increase in service
charges on deposit accounts, an $11.6 million, or 32%, increase in capital market fees, and an $11.2 million
bargain purchase gain related to the acquisition of Fidelity Bank. These positive impacts were offset partially by
a $29.4 million, or 26%, decrease in electronic banking income, which was negatively impacted by over $55
million from the Durbin amendment, and a $16.0 million, or 11%, decrease in other income, reflecting a $16.5
million, or 62%, decrease in automobile operating lease income. We continue to make progress in shifting the
overall mix of total revenue towards our goal of 40% as noninterest income was 38.8% of total revenue, up from
37.4% in 2011.
Net interest income increased $86.8 million, or 5%, in 2012. This reflected a $2.1 billion, or 4%, increase in
average earning assets and a 3 basis point increase in the NIM to 3.41%. The increase in the NIM reflected the
positive impact of a 29 basis point decline in total deposit costs that were offset partially by a 24 basis point
decline in the yield on earnings assets and a 2 basis point decrease related to non-deposit funding and other items.
Average noninterest bearing deposits increased $3.5 billion, or 41%, and represented 27% of total deposits.
The $2.1 billion, or 4%, increase in average earning assets was driven by the $1.9 billion, or 10%, increase
in average total commercial loans and $0.8 billion increase in average loans held for sale. Those were offset
partially by a $0.6 billion, or 3%, decrease in average consumer loans including a $1.4 billion, or 23%, decrease
in automobile loans, reflecting $2.5 billion of automobile loans sold throughout the year.
For the year, average total core deposits increased $3.1 billion, or 8%, reflecting a $3.8 billion, or 27%,
increase in total demand deposits and a $0.6 billion, or 4%, increase in money market deposits. These were offset
2