Huawei 2012 Annual Report Download - page 7
Download and view the complete annual report
Please find page 7 of the 2012 Huawei annual report below. You can navigate through the pages in the report by either clicking on the pages listed below, or by using the keyword search tool below to find specific information within the annual report.-
 1
1 -
 2
2 -
 3
3 -
 4
4 -
 5
5 -
 6
6 -
 7
7 -
 8
8 -
 9
9 -
 10
10 -
 11
11 -
 12
12 -
 13
13 -
 14
14 -
 15
15 -
 16
16 -
 17
17 -
 18
18 -
19
-
20
-
21
-
22
-
23
-
24
-
25
-
26
-
27
-
28
-
29
-
30
-
31
-
32
-
33
-
34
-
35
-
36
-
37
-
38
-
39
-
40
-
41
-
42
-
43
-
44
-
45
-
46
-
47
-
48
-
49
-
50
-
51
-
52
-
53
-
54
-
55
-
56
-
57
-
58
-
59
-
60
-
61
-
62
-
63
-
64
-
65
-
66
-
67
-
68
-
69
-
70
-
71
-
72
-
73
-
74
-
75
-
76
-
77
-
78
-
79
-
80
-
81
-
82
-
83
-
84
-
85
-
86
-
87
-
88
-
89
-
90
-
91
-
92
-
93
-
94
-
95
-
96
-
97
-
98
-
99
-
100
-
101
-
102
-
103
-
104
-
105
-
106
-
107
-
108
-
109
-
110
-
111
-
112
-
113
-
114
-
115
-
116
-
117
-
118
-
119
-
120
-
121
-
122
 |
 |

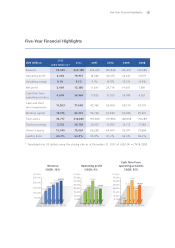
Five-Year Financial Highlights
Five-Year Financial Highlights 4
CNY Million 2012
(USD Million)* 2012 2011 2010 2009 2008
Revenue 35,353 220,198 203,929 182,548 146,607 123,080
Operating profit 3,204 19,957 18,582 30,676 22,241 17, 076
Operating margin 9.1% 9.1% 9.1% 16.8% 15.2% 13.9%
Net profit 2,469 15,380 11, 6 47 24,716 19,001 7,891
Cash flow from
operating activities 4,009 24,969 17, 826 31,555 24,188 4,561
Cash and short
term investments 11,503 71,649 62,342 55,458 38,214 24,133
Working capital 10,155 63,251 56,728 60,899 43,286 25,921
Total assets 33,717 210,006 193,849 178,984 148,968 119,28 6
Total borrowings 3,332 20,754 20,327 12,959 16,115 17,14 8
Owner’s equity 12,045 75,024 66,228 69,400 52,741 37,8 8 6
Liability Ratio 64.3% 64.3% 65.8% 61.2% 64.6% 68.2%
* Translated into US dollars using the closing rate as at December 31, 2012 of US$1.00 = CNY6.2285
CAGR: 16%
Revenue Operating profit
Cash flow from
operating activities
123,080
146,607
182,548
203,929
220,198
CNY Million CNY Million CNY Million
08 09 10 11 12- :FBS
0
50,000
100,000
150,000
200,000
250,000
CAGR: 4%
17,076
22,241
30,676
18,582
19,957
08 09 10 11 12- :FBS
0
5,000
10,000
15,000
20,000
25,000
30,000
35,000
CAGR: 53%
4,561
24,188
31,555
17,826
24,969
08 09 10 11 12- :FBS
0
5,000
10,000
15,000
20,000
25,000
30,000
35,000