Harris Teeter 2011 Annual Report Download - page 16
Download and view the complete annual report
Please find page 16 of the 2011 Harris Teeter annual report below. You can navigate through the pages in the report by either clicking on the pages listed below, or by using the keyword search tool below to find specific information within the annual report.-
 1
1 -
2
-
3
-
4
-
5
-
 6
6 -
 7
7 -
 8
8 -
 9
9 -
 10
10 -
 11
11 -
 12
12 -
 13
13 -
 14
14 -
 15
15 -
 16
16 -
 17
17 -
 18
18 -
 19
19 -
 20
20 -
 21
21 -
 22
22 -
 23
23 -
 24
24 -
 25
25 -
 26
26 -
27
-
28
-
29
-
30
-
31
-
32
-
33
-
34
-
35
-
36
-
37
-
38
-
39
-
40
-
41
-
42
-
43
-
44
-
45
-
46
-
47
-
48
-
49
-
50
-
51
-
52
-
53
-
54
-
55
-
56
-
57
-
58
-
59
-
60
-
61
-
62
-
63
-
64
-
65
-
66
-
67
-
68
-
69
-
70
-
71
-
72
-
73
-
74
-
75
-
76
-
77
-
78
-
79
-
80
-
81
-
82
-
83
-
84
-
85
-
86
-
87
-
88
-
89
-
90
-
91
-
92
-
93
-
94
-
95
-
96
-
97
-
98
-
99
-
100
-
101
-
102
-
103
-
104
-
105
-
106
-
107
-
108
-
109
-
110
-
111
-
112
-
113
-
114
-
115
-
116
 |
 |

Consolidated
Net interest expense (interest expense less interest income) decreased $0.5 million in fiscal 2011 from fiscal 2010 primarily
as a result of lower interest on debt borrowings due to lower average outstanding borrowings. The reduction in interest expense
on debt borrowings between fiscal 2010 and 2011 was offset, in part, by increased interest associated with capital leases. Net
interest expense increased $3.0 million in fiscal 2010 from fiscal 2009 primarily as a result of increased interest associated with
capital leases recorded at Harris Teeter.
Net investment gains for fiscal 2011 include a gain the Company realized upon the sale of its interest in a foreign investment
company. As previously disclosed, the Company recorded a pre-tax gain of $19.5 million in the first quarter of fiscal 2011.
The effective consolidated income tax rate on continuing operations in fiscal 2011 was 38.5% as compared to 37.4% for
fiscal 2010 and 38.5% for fiscal 2009. Income tax expense for fiscal 2011 included additional foreign taxes paid in connection
with the investment gain discussed above and income tax expense for fiscal 2009 included adjustments made for an increase
in the Company’s state income taxes.
As a result of the items discussed above, earnings from continuing operations after tax was $111.5 million, or $2.28 per
diluted share in fiscal 2011, as compared to $98.7 million, or $2.03 per diluted share in fiscal 2010 (a 53-week year) and $93.6
million, or $1.94 per diluted share in fiscal 2009. The after-tax gain on the sale of the Company’s foreign investment increased
fiscal 2011 earnings from continuing operations by $10.3 million, or $0.21 per diluted share.
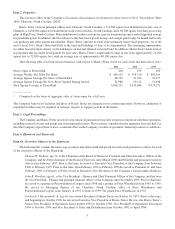
The following table sets forth the historical operating results of A&E for the 52 weeks of fiscal 2011, the 53 weeks of fiscal
2010 and the 52 weeks of fiscal 2009, which have been reclassified as discontinued operations (in thousands):
Fiscal 2011 Fiscal 2010 Fiscal 2009
Net Sales $320,876 $301,097 $250,817
Cost of Sales 241,539 228,685 202,901
Gross Profit 79,337 72,412 47,916
SG&A Expenses 52,351 51,297 51,288
Goodwill Impairment - - 7,654
Long-Lived Asset Impairments - - 2,237
Operating Profit (Loss) 26,986 21,115 (13,263)
Interest Expense 380 421 732
Interest Income (170) (66) (479)
Less Net Earnings Attributable to Noncontrolling Interest 698 1,067 594
Earnings (Loss) From Discontinued Operations 26,078 19,693 (14,110)
Income Tax Expense (Benefit) 9,816 6,304 (6,477)
Loss on Sale of Discontinued Operations, Net of $12,277 of
Income Tax Benefits (36,473) - -
Earnings (Loss) From Discontinued Operations, Net of Taxes $ (20,211) $ 13,389 $ (7,633)
As previously disclosed, A&E recorded non-cash impairment charges during fiscal 2009 totaling $9.9 million related to
its U.S. operating unit. Impairment charges included $7.7 million for the write-off of all of the goodwill associated with its U.S.
acquisitions previously made in 1995 and 1996, and $2.2 million for the write-down of long-lived assets.
Outlook
The Company’s operating performance and strong financial position provide the flexibility to continue with Harris Teeter’s
store development program that includes new and replacement stores along with the remodeling and expansion of existing stores.
During fiscal 2012, Harris Teeter plans to open seven new stores (one of which will replace an existing store) and complete
major remodels on twelve stores (six of which will be expanded in size). The fiscal 2012 new store openings are currently
scheduled for three in the first quarter, three in the third quarter and one in the fourth quarter and will result in a 3.7% increase
in retail square footage as compared to a 3.2% increase in fiscal 2011. Management will continue to evaluate Harris Teeter’s
capital expenditures during these times of economic uncertainty and will adjust its strategic plan accordingly. In addition, Harris
Teeter routinely evaluates its existing store operations in regards to its overall business strategy and from time to time will close
or divest older or underperforming stores.
The new store program anticipates the continued expansion of Harris Teeter’s existing markets, including the Washington,
D.C. metro market area which incorporates northern Virginia, the District of Columbia, southern Maryland and coastal
12