Harris Teeter 2011 Annual Report Download - page 15
Download and view the complete annual report
Please find page 15 of the 2011 Harris Teeter annual report below. You can navigate through the pages in the report by either clicking on the pages listed below, or by using the keyword search tool below to find specific information within the annual report.-
 1
1 -
2
-
3
-
4
-
 5
5 -
 6
6 -
 7
7 -
 8
8 -
 9
9 -
 10
10 -
 11
11 -
 12
12 -
 13
13 -
 14
14 -
 15
15 -
 16
16 -
 17
17 -
 18
18 -
 19
19 -
 20
20 -
 21
21 -
 22
22 -
 23
23 -
 24
24 -
 25
25 -
26
-
27
-
28
-
29
-
30
-
31
-
32
-
33
-
34
-
35
-
36
-
37
-
38
-
39
-
40
-
41
-
42
-
43
-
44
-
45
-
46
-
47
-
48
-
49
-
50
-
51
-
52
-
53
-
54
-
55
-
56
-
57
-
58
-
59
-
60
-
61
-
62
-
63
-
64
-
65
-
66
-
67
-
68
-
69
-
70
-
71
-
72
-
73
-
74
-
75
-
76
-
77
-
78
-
79
-
80
-
81
-
82
-
83
-
84
-
85
-
86
-
87
-
88
-
89
-
90
-
91
-
92
-
93
-
94
-
95
-
96
-
97
-
98
-
99
-
100
-
101
-
102
-
103
-
104
-
105
-
106
-
107
-
108
-
109
-
110
-
111
-
112
-
113
-
114
-
115
-
116
 |
 |
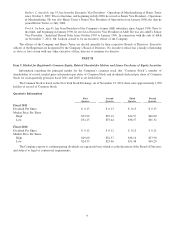
have a close proximity to existing stores. Management believes that Harris Teeter’s strategy of opening additional stores within
close proximity to existing stores, and any similar new additions in the foreseeable future, have a strategic benefit of enabling
Harris Teeter to capture sales and expand market share as the markets it serves continue to grow. During fiscal 2011, Harris
Teeter experienced an increase in customer visits, number of items sold and the average basket size. In addition, Harris Teeter
experienced average increases in active households per comparable store (based on VIC data) of 1.69%, evidencing a continued
growing customer base in those stores. Store brand penetration, based on units sold, has also increased on a year over year basis.
Store brand penetration based on units sold was 23.95% in fiscal 2011, as compared to 23.58% in fiscal 2010. Store brand
penetration based on sales dollars was down 5 basis points year over year at 24.57% in fiscal 2011, as compared to 24.62%
in fiscal 2010; however, the dollar penetration for the quarter improved year over year, coming in at 25.12% for the fourth quarter
of fiscal 2011, as compared to 24.67% in the fourth quarter of fiscal 2010.
Harris Teeter considers its reporting of comparable store sales growth to be effective in determining core sales growth
during periods of fluctuation in the number of stores in operation, their locations and their sizes. While there is no standard
industry definition of “comparable store sales,” Harris Teeter has been consistently applying the following definition.
Comparable store sales are computed using corresponding calendar weeks to account for the occasional extra week included
in a fiscal year. A new store must be in operation for 14 months before it enters into the calculation of comparable store sales.
A closed store is removed from the calculation in the month in which its closure is announced. A new store opening within an
approximate two-mile radius of an existing store that is to be closed upon the new store opening is included as a replacement
store in the comparable store sales measurement as if it were the same store. Sales increases resulting from existing comparable
stores that are expanded in size are included in the calculations of comparable store sales, if the store remains open during the
construction period. Comparable store sales for fiscal 2011 was computed on a 52-week basis by reducing fiscal 2010 sales
for the first week of the annual period and comparable store sales for fiscal 2010 was computed on a 53-week basis by adding
an additional week of sales to fiscal 2009.
Gross profit as a percent to sales declined 30 basis points from fiscal 2010 to fiscal 2011 and declined 62 basis points from
fiscal 2009 to fiscal 2010. The decrease in the gross profit margin from fiscal 2010 to fiscal 2011 was driven primarily by an
increase in the LIFO charge recorded in fiscal 2011. Harris Teeter continued to drive sales through its promotional activity, which
includes lowering the sales price on selected items (price investment) and resulted in a reduction in the gross profit margin by
2 basis points during fiscal 2011 and 71 basis points during fiscal 2010. The annual LIFO adjustment reduced gross profit by
$11.1 million (0.26% to sales) in fiscal 2011, increased gross profit by $1.6 million (0.04% to sales) in fiscal 2010, and reduced
gross profit by $4.4 million (0.12% to sales) in fiscal 2009.
Selling, general & administrative (“SG&A”) expenses at Harris Teeter increased during fiscal 2011 and fiscal 2010 when
compared to prior years, as a result of incremental store growth and its impact on associated operational costs such as labor,
healthcare expense, credit and debit card fees, rent and other occupancy costs. However, SG&A expenses as a percent to sales
decreased 33 basis points in fiscal 2011 and 46 basis points in fiscal 2010, as a result of the leverage created through sales gains
that apply against fixed costs, along with improved labor management and other cost control initiatives. The increase in SG&A
expenses (excluding advertising and support department costs) over the previous year for stores opened in fiscal 2011 accounted
for $28.6 million of the $33.1 million increase in total SG&A expenses from fiscal 2010 to fiscal 2011. The increase in SG&A
expenses (excluding advertising and support department costs) over the previous year for stores opened in fiscal 2010 accounted
for $45.0 million of the $52.0 million increase in total SG&A expenses from fiscal 2009 to fiscal 2010. Even though store labor
and associated benefit costs increased, as a result of Harris Teeter’s new store growth, there was a 29 basis point reduction in
these costs as a percent to sales from fiscal 2010 to fiscal 2011 and a 23 basis point reduction from fiscal 2009 to fiscal 2010.
Advertising and support department costs as a percent to sales also declined and represented a 5 basis point reduction between
fiscal 2010 and 2011 and a 42 basis point reduction between fiscal 2009 and 2010. Included with SG&Aexpenses are pre-opening
costs, which consist of pre-opening rent, labor and associated fringe benefits and recruiting and relocations costs incurred prior
to a new store opening and amounted to $7.0 million (0.16% to sales) in fiscal 2011, $8.4 million (0.20% of sales) in fiscal
2010 and $14.4 million (0.37% of sales) in fiscal 2009. Pre-opening costs fluctuate between periods depending on the new store
opening schedule and market location.
Corporate
Corporate SG&A expenses include a portion of compensation and benefits of holding company employees and certain other
costs that have not historically been allocated to the operating companies. Corporate SG&A increased to $10.4 million in 2011
from $4.7 million in 2010. Corporate SG&A decreased $2.7 million in 2010 from 2009. As previously disclosed, Corporate
SG&A expenses in fiscal 2010 were reduced by $3.9 million as a result of gains realized in connection with the exchange of
the Company’s corporate aircraft. Adjusting fiscal 2010 for the gains, Corporate SG&A expenses increased by $1.7 million as
a result of increased depreciation expense on the corporate aircraft and lower earnings on company-owned life insurance.
11