Harris Teeter 2011 Annual Report Download - page 14
Download and view the complete annual report
Please find page 14 of the 2011 Harris Teeter annual report below. You can navigate through the pages in the report by either clicking on the pages listed below, or by using the keyword search tool below to find specific information within the annual report.-
 1
1 -
2
-
3
-
 4
4 -
 5
5 -
 6
6 -
 7
7 -
 8
8 -
 9
9 -
 10
10 -
 11
11 -
 12
12 -
 13
13 -
 14
14 -
 15
15 -
 16
16 -
 17
17 -
 18
18 -
 19
19 -
 20
20 -
 21
21 -
 22
22 -
 23
23 -
 24
24 -
25
-
26
-
27
-
28
-
29
-
30
-
31
-
32
-
33
-
34
-
35
-
36
-
37
-
38
-
39
-
40
-
41
-
42
-
43
-
44
-
45
-
46
-
47
-
48
-
49
-
50
-
51
-
52
-
53
-
54
-
55
-
56
-
57
-
58
-
59
-
60
-
61
-
62
-
63
-
64
-
65
-
66
-
67
-
68
-
69
-
70
-
71
-
72
-
73
-
74
-
75
-
76
-
77
-
78
-
79
-
80
-
81
-
82
-
83
-
84
-
85
-
86
-
87
-
88
-
89
-
90
-
91
-
92
-
93
-
94
-
95
-
96
-
97
-
98
-
99
-
100
-
101
-
102
-
103
-
104
-
105
-
106
-
107
-
108
-
109
-
110
-
111
-
112
-
113
-
114
-
115
-
116
 |
 |

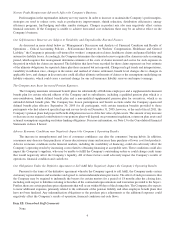
The following table sets forth the consolidated operating profit components for Harris Teeter and for the holding company
(“Corporate”) for the 52 weeks ended October 2, 2011 (fiscal 2011), the 53 weeks ended October 3, 2010 (fiscal 2010) and
the 52 weeks ended September 27, 2009 (fiscal 2009). The table also sets forth the percentage increase or decrease of such
components over the prior year (in thousands):
Fiscal 2011 Fiscal 2010 Fiscal 2009 % Inc. (Dec.)
%to
Sales
%to
Sales
%to
Sales
11 vs
10
10 vs
09
Net Sales $4,285,565 100.00 $4,099,353 100.00 $3,827,005 100.00 4.5 7.1
Cost of Sales 3,015,517 70.36 2,871,907 70.06 2,657,564 69.44 5.0 8.1
Gross Profit 1,270,048 29.64 1,227,446 29.94 1,169,441 30.56 3.5 5.0
SG&A Expenses
Harris Teeter 1,078,978 25.18 1,045,860 25.51 993,850 25.97 3.2 5.2
Corporate 10,364 0.24 4,730 0.12 7,477 0.20 119.1 (36.7)
Total 1,089,342 25.42 1,050,590 25.63 1,001,327 26.17 3.7 4.9
Operating Profit 180,706 4.22 176,856 4.31 168,114 4.39 2.2 5.2
Interest Expense, net 18,983 0.44 19,521 0.47 16,561 0.43 (2.8) 17.9
Net Investment Gains 19,392 0.45 310 0.01 746 0.02 n.m. n.m.
Earnings From Continuing Operations
Before Income Taxes 181,115 4.23 157,645 3.85 152,299 3.98 14.9 3.5
Income Tax Expense 69,657 1.63 58,993 1.44 58,702 1.53 18.1 0.5
Earnings From Continuing Operations 111,458 2.60 98,652 2.41 93,597 2.45 13.0 5.4
Earnings (Loss) From Discontinued
Operations, Before Income Taxes 26,078 19,693 (14,110)
Income Tax Expense (Benefit) 9,816 6,304 (6,477)
Loss on Sale of Discontinued
Operations, net of Taxes (36,473) - -
Earnings (Loss) From Discontinued
Operations (20,211) 13,389 (7,633)
Net Earnings $ 91,247 $ 112,041 $ 85,964
_______________
n.m. – not meaningful
Harris Teeter
Net sales increased 4.5% in fiscal 2011 and 7.1% in fiscal 2010 when compared to the respective prior years. The increase
in sales in fiscal 2011 was attributable to incremental new store sales and an increase in comparable store sales. On a comparable
week basis (reducing fiscal 2010 sales for the first week of the annual period), sales increased by 6.40% from fiscal 2010 to
fiscal 2011. The increase in sales in fiscal 2010 was attributable to sales from incremental new stores and an extra week of
operations. On a comparable week basis (reducing fiscal 2010 sales for the last week of the annual period), sales increased by
5.10% from fiscal 2009 to fiscal 2010. The fiscal 2010 sales increase was partially offset by a comparable store sales decline.
During fiscal 2011, Harris Teeter opened seven new stores (one of which replaced an existing store) and closed two stores, for
a net addition of five stores. During fiscal 2010, Harris Teeter opened 13 new stores (two of which replaced existing stores)
and closed three stores, for a net addition of 10 stores. During fiscal 2009, Harris Teeter opened 15 new stores (two of which
replaced existing stores) and closed two stores, for a net addition of 13 stores. The increase in sales from new stores exceeded
the loss of sales from closed stores by $122.0 million in fiscal 2011, $238.2 million in fiscal 2010 and $225.4 million in fiscal
2009. Comparable store sales (see definition below) increased by 3.27% ($129.4 million) in fiscal 2011, decreased by 1.10%
($42.0 million) in fiscal 2010 and decreased by 1.49% ($53.1 million) in fiscal 2009. Comparable store sales have been
negatively impacted, to some extent, by the cannibalization created by strategically opening stores in key major markets that
10