Exxon 2013 Annual Report Download - page 8
Download and view the complete annual report
Please find page 8 of the 2013 Exxon annual report below. You can navigate through the pages in the report by either clicking on the pages listed below, or by using the keyword search tool below to find specific information within the annual report.-
 1
1 -
 2
2 -
 3
3 -
 4
4 -
 5
5 -
 6
6 -
 7
7 -
 8
8 -
 9
9 -
 10
10 -
 11
11 -
 12
12 -
 13
13 -
 14
14 -
 15
15 -
 16
16 -
 17
17 -
 18
18 -
 19
19 -
20
-
21
-
22
-
23
-
24
-
25
-
26
-
27
-
28
-
29
-
30
-
31
-
32
-
33
-
34
-
35
-
36
-
37
-
38
-
39
-
40
-
41
-
42
-
43
-
44
-
45
-
46
-
47
-
48
-
49
-
50
-
51
-
52
 |
 |

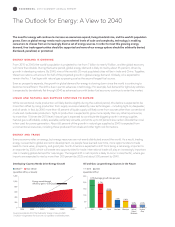
The Outlook for Energy: A View to 2040
The need for energy will continue to increase as economies expand, living standards rise, and the world’s population
grows. Even as global energy needs reach unprecedented levels of scale and complexity, technology is enabling
consumers to choose from an increasingly diverse set of energy sources. In order to meet this growing energy
demand, free trade opportunities should be supported and none of our energy options should be arbitrarily denied,
dismissed, penalized, or promoted.
ENERGY DEMAND IS GROWING
From 2010 to 2040, the world’s population is projected to rise from 7 billion to nearly 9 billion, and the global economy
will more than double. During that same period, global energy demand is likely to rise by about 35 percent, driven by
growth in developing nations. By 2040, nine of the world’s 20 most populated cities will be in India and China. Together,
these two nations will account for half of the projected growth in global energy demand. Globally, oil is expected to
remain the No. 1 fuel type with natural gas surpassing coal as the second-largest fuel source.
Even as prosperity expands, the growth in global demand for energy is slowing down since the world is continuing to
become more efficient. The shift is due in part to advances in technology. For example, fuel demand for light-duty vehicles
is expected to be relatively flat through 2040 as advanced cars with better fuel economy continue to enter the market.
LIQUID AND NATURAL GAS SUPPLIES CONTINUE TO EXPAND
While conventional crude production will likely decline slightly during the outlook period, this decline is expected to be
more than offset by rising production from supply sources enabled by new technologies – including tight oil, deepwater,
and oil sands. In fact, by 2040 more than 45 percent of liquids supply will likely come from sources other than conventional
crude and condensate production. Tight oil production is expected to grow more rapidly than any other liquid source,
to more than 10 times the 2010 level. Natural gas is expected to contribute the biggest growth in energy supplies.
Natural gas is affordable, widely available, extremely versatile, and emits up to 60 percent less carbon dioxide than coal
when used for power generation. About 65 percent of the growth in natural gas supplies by 2040 is expected from
unconventional resources, including those produced from shale and other tight rock formations.
ENERGY AND TRADE
Every economy relies on energy, but energy resources are not evenly distributed around the world. As a result, trading
energy is essential to global economic development. As people have learned over time, more opportunities to trade
leads to more value, prosperity, and good jobs. North America is expected to shift from being a net energy importer to
an exporter by 2025, which will create new opportunities for trade. International trade will play an increasingly important
role in meeting global demand for natural gas. The largest shift in net imports is likely to occur in Asia Pacific, where gas
imports are expected to rise by more than 300 percent by 2025 and about 500 percent by 2040.
Eric Whetstone • Whetstone Design
EDITOR
Julio E. Tamacas • Investor Relations
Exxon Mobil Corporation, Irving, TX
Office: 972.444.1135
Cell: 972.249.8901
Carol Zuber-Mallison • ZM Graphics, Inc.
studio/cell: 214-906-4162 • fax: 817-924-7784
ATTENTION: OWNER
thoroughly proof the nal artwork, not
VERSION
APPROVED BY
FILE INFO
LAST FILE CHANGE MADE BY
C S06A 13XOM-
GlblEnrgyDmnd.ai
IN F&O ON PAGE
IN SAR ON PAGE S06A
Includes link le
Data as of 12/09/2013:
"1990" 190.3 170.4
192.7 172.4
197.5 170.6
202 170.5
"1995" 207 176.1
213.7 179.7
216.2 181.9
217.1 183.3
220.7 185.8
"2000" 225.6 192.8
224.4 197.1
225.4 203.2
228 216
232.8 230.7
"2005" 234.1 242.1
234.2 254.2
236.8 265.3
232.5 273.2
222.7 278.4
"2010" 230.5 292.2
227.6 306
224.7 313.2
225.2 321.3
227 330.5
"2015" 228 340
229.4 349.4
230.5 358.2
231.2 367.2
231.9 376.8
"2020" 232.3 386.7
"2025" 232.5 421.4
"2030" 230.5 450.1
"2035" 226 468.3
"2040" 221.6 488.1
OECD(1)
Energy saved through
efficiency gains ~500 Quads
Developing-Country Needs Drive Energy Growth
(quadrillion BTUs, or Quads)
1,200
1,000
800
600
400
200
0
Non-OECD
Source: ExxonMobil, 2014 The Outlook for Energy: A View to 2040
(1) OECD = Organisation for Economic Co-operation and Development.
1990 2000 2010 2020 2030 2040
522.7
549.1
562
654.8
805.7
927.9
1054.5
Eric Whetstone • Whetstone Design
EDITOR
Julio E. Tamacas • Investor Relations
Exxon Mobil Corporation, Irving, TX
Office: 972.444.1135
Cell: 972.249.8901
Carol Zuber-Mallison • ZM Graphics, Inc.
studio/cell: 214-906-4162 • fax: 817-924-7784
ATTENTION: OWNER
thoroughly proof the nal artwork, not
VERSION
APPROVED BY
FILE INFO
LAST FILE CHANGE MADE BY
C S06B 13XOM-
EnergyMix.ai
IN F&O ON PAGE
IN SAR ON PAGE S06B
Includes link le
Data as of 12/09/2013:
"2010" "2040"
Oil 178.3 221.1
Coal 133.3 133.4
Nuclear 28.5 59.5
Biomass/Other 48.3 54.6
Solar / Wind / Biofuels 4.6 25.9
Hydro / Geo 14.3 25.6
2010 2040
Oil and Gas: Largest Energy Sources in the Future
(quadrillion BTUs)
250
200
150
100
50
0Oil
0.7% Average growth rate per year
Gas
1.7%
Coal
0.0%
Nuclear
2.5%
Biomass
0.4%
Wind/
Solar/
Biofuels
5.9%
Hydro/
Geo
2.0%
EXXONMOBIL 2013 SUMMARY ANNUAL REPORT
6