Exxon 2013 Annual Report Download - page 7
Download and view the complete annual report
Please find page 7 of the 2013 Exxon annual report below. You can navigate through the pages in the report by either clicking on the pages listed below, or by using the keyword search tool below to find specific information within the annual report.-
 1
1 -
 2
2 -
 3
3 -
 4
4 -
 5
5 -
 6
6 -
 7
7 -
 8
8 -
 9
9 -
 10
10 -
 11
11 -
 12
12 -
 13
13 -
 14
14 -
 15
15 -
 16
16 -
 17
17 -
 18
18 -
19
-
20
-
21
-
22
-
23
-
24
-
25
-
26
-
27
-
28
-
29
-
30
-
31
-
32
-
33
-
34
-
35
-
36
-
37
-
38
-
39
-
40
-
41
-
42
-
43
-
44
-
45
-
46
-
47
-
48
-
49
-
50
-
51
-
52
 |
 |

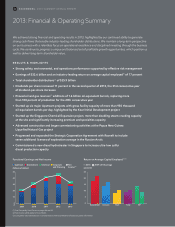
FINANCIAL HIGHLIGHTS
(millions of dollars, unless noted)
Earnings After
Income Taxes
Average
Capital
Employed
(1)
Return on
Average Capital
Employed (%)
(1)
Capital and
Exploration
Expenditures
(1)
Upstream 26,841 152,969 17. 5 38,231
Downstream 3,449 24,430 14.1 2,413
Chemical 3,828 20,665 18.5 1,832
Corporate and Financing (1,538)(6,489)N.A. 13
Total 32,580 191,575 17. 2 42,489
OPERATING HIGHLIGHTS
Liquids production (net, thousands of barrels per day) 2,202
Natural gas production available for sale (net, millions of cubic feet per day) 11,836
Oil-equivalent production
(2)
(net, thousands of oil-equivalent barrels per day) 4,175
Refinery throughput (thousands of barrels per day) 4,585
Petroleum product sales (thousands of barrels per day) 5,887
Chemical prime product sales
(1)
(thousands of tonnes) 24,063
Dividend Growth Since 1984(3)
(dollars per share)
ExxonMobil S&P 500 Consumer Price Index(4)
(1) See Frequently Used Terms on pages 44 and 45.
(2) Natural gas converted to oil-equivalent at 6 million cubic feet per 1 thousand barrels.
(3) S&P and CPI indexed to 1984 Exxon dividend.
(4) CPI based on historical yearly average from Bureau of Labor Statistics.
(5) Royal Dutch Shell, BP, Chevron, and Total values are on a consistent basis with ExxonMobil, based on public information.
Eric Whetstone • Whetstone Design
Julio E. Tamacas • Investor Relations
Exxon Mobil Corporation, Irving, TX
Office: 972.444.1135
Cell: 972.249.8901
Carol Zuber-Mallison • ZM Graphics, Inc.
studio/cell: 214-906-4162 • fax: 817-924-7784
thoroughly proof the nal artwork, not
C S05A 13XOM-
Includes link le
different footnotes
"84" 0.42 0.42 0.42
"90" 0.62 0.67 0.53
0.72 0.70 0.58
0.82 0.90 0.66
0.92 0.89 0.72
"05" 1.14 1.23 0.79
1.28 1.38 0.81
'09 1.66 1.25 0.86
'10 1.74 1.26 0.88
‘12 2.18 1.74 0.93
’13 2.46 1.94 0.94
DATA as of 01/30/2014
2.50
2.00
1.50
1.00
0.50
01994 20041984
2013
Total Shareholder Returns(1)
(percent per year)
ExxonMobil S&P 500Integrated Oil Competitor Average(5)
Eric Whetstone • Whetstone Design
EDITOR
Julio E. Tamacas • Investor Relations
Exxon Mobil Corporation, Irving, TX
Office: 972.444.1135
Cell: 972.249.8901
Carol Zuber-Mallison • ZM Graphics, Inc.
studio/cell: 214-906-4162 • fax: 817-924-7784
ATTENTION: OWNER
thoroughly proof the nal artwork, not
VERSION
APPROVED BY
FILE INFO
LAST FILE CHANGE MADE BY
C S05B 13XOM-
IN F&O ON PAGE
IN SAR ON PAGE
Includes link le
different footnotes
DATA as of 02/8/2014
3 Years 14.3 10.5 16.2
10 Years 11.9 8.8 7.4
20 Years 12.6 10.7 9.2
18
15
12
9
6
3
020 Years
10 Years5 Years3 Years
5